IELTS Academic Writing Task 1: Main Reasons why Agricultural Land Becomes Less Productive
6 min read
Updated On
-
Copy link
Get access to the IELTS Writing Task 1 Pie chart sample answers of 'Main Reasons Why Agricultural Land Becomes Less Productive' here!
Table of Contents

Limited-Time Offer : Access a FREE 10-Day IELTS Study Plan!
While answering IELTS Academic Writing Task 1, you have to summarize the information that is presented in the form of a graph or an IELTS process diagram. The type of graph varies from line graphs and bar graphs to pie charts and tables. Other than that, it can also be a combination of any of the aforementioned types, like in the topic – Main Reasons why Agricultural Land Becomes Less Productive’.
To score a high band score in IELTS Academic Writing Task 1, you have to acquaint yourself with all these types as well as master the tricks to write at least 150 words within 20 minutes by practising them regularly.
You will find Band 8 & Band 9 sample answers on a combination task, ‘Main Reasons why Agricultural Land Becomes Less Productive’, in this article. So, let us begin with a quick overview of the combination task and check out the four sample answers following it.
IELTS Academic Writing Task 1: Combination Charts
The combination charts given in IELTS Academic Writing Task 1 is a blend of any two different types of graphs, like a line graph and a bar chart or a pie chart and a table.
In this case, you should clearly explain each graph, compare them where relevant, and provide detailed information on the main features of both graphs. For the given topic – Main Reasons why Agricultural Land Becomes Less Productive – it is a combination of a IELTS pie chart and a IELTS table chart.
To improve their writing skills for IELTS Writing Task 1, check out the IELTS Writing Task 1 practice papers.
What are you waiting for? Book a free trial & talk to our Experts NOW!
Question
You should spend about 20 minutes on this task.
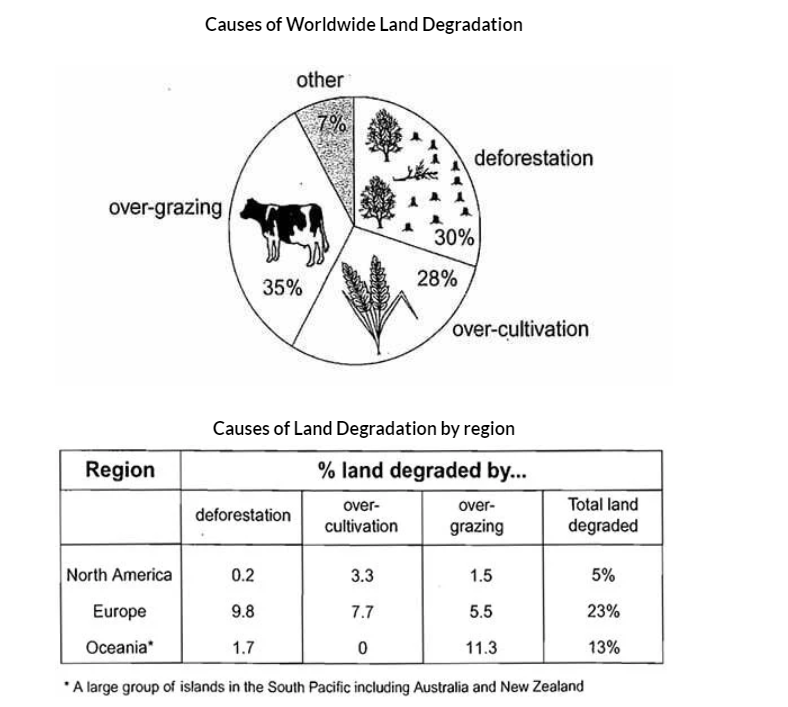
The pie chart below shows the main reasons why agricultural land becomes less productive. The table shows how these causes affected three regions of the world during the 1990s.
Summarise the information by selecting and reporting on the main features, and make comparisons where relevant.
Write at least 150 words.

Plan Your IELTS Writing Task 1 Combination Chart
Given below is a detailed structure that will assist you in organizing your answer for IELTS Writing Task 1 Combination Charts. It will help you utilize your time efficiently and ensure that your essay for IELTS Academic Writing Task 1 is coherent and well-structured.
Introduction: Begin your IELTS Writing Task 1 Combination Charts by summarizing the question in your own words in one or two sentences.
Overview: Here, you point out the key features of each graph in two to three sentences.
Body: The body will be divided into two different paragraphs.
|
Read – IELTS Academic Writing Task 1 : Compare and Contrast
Learn from the IELTS Sample Answers on “Main Reasons why Agricultural Land Becomes Less Productive”
It is time to dive into some sample answers below, which will give you an idea of how to frame your IELTS Academic Writing Task 1 answers with clarity.
Sample Answer 1
The pie chart in the first image shows the different causes of land degradation. The table portrays the various causes of land degradation in different regions.
Overall it is evident that deforestation and overgrazing are two of the major reasons for the deterioration of agricultural land and Europe had the highest percentage of degraded land in 1990.
Deforestation accounts for 30% of land degradation and the same from overgrazing is 35%, making these two the primary reasons for diminishing land quality. Overcultivation also contributes 28% to land degradation, along with other factors contributing 7% in total.
The main causes of land degradation in Europe were deforestation and over-cultivation. In North America, the degradation of land was due to over-cultivation and overgrazing. As for Oceania, overgrazing was the chief cause of degraded agricultural land, and deforestation marginally contributed to the issue.
Check This: All Useful IELTS Writing Lessons & Websites
Band 7 Sample Answer
The provided pie chart illustrates the primary factors contributing to global land degradation, while the accompanying table presents data regarding the impact of these causes on three distinct regions during the 1990s.
In a broader perspective, it becomes evident that overgrazing, deforestation, and over-cultivation stand out as the predominant drivers of agricultural land degradation on a global scale. Notably, Europe emerges as the region with the most substantial percentage of land degradation when compared to Oceania and North America.
Specifically, overgrazing, responsible for a significant 35% of global land degradation, takes precedence as the leading cause. Following closely are deforestation and over-cultivation, contributing 30% and 28% to the overall land degradation scenario.
Europe primarily suffered from land degradation because of deforestation and over-cultivation. In North America, land degradation resulted from over-cultivation and overgrazing. Meanwhile, Oceania’s agricultural land degradation was chiefly attributed to overgrazing, with a minor influence from deforestation. These findings underscore the critical need for sustainable land management practices to mitigate the detrimental impact of these factors and preserve agricultural land worldwide.
Waiting for an Exclusive Study Material on IELTS Writing Task 1?
Band 8 Sample Answer
The pie chart elucidates diverse land degradation causes, while the subsequent table delineates regional variations in these causes.
Globally, deforestation and overgrazing emerge as primary factors in agricultural land deterioration, with Europe witnessing the most significant degradation in 1990.
Deforestation contributes to 30% of land degradation, while overgrazing accounts for 35%, establishing them as principal culprits. Overcultivation also significantly impacts land, with a 28% contribution, while other factors collectively represent 7%.
Europe’s land degradation is primarily attributed to deforestation and over-cultivation. In North America, over-cultivation and overgrazing are the key drivers. Conversely, Oceania predominantly suffers from overgrazing, with deforestation playing a minor role in agricultural land degradation. This analysis underscores the need for region-specific strategies to combat land degradation effectively.
Band 9 Sample Answer
The pie chart in the first image provides a comprehensive overview of the distinct factors contributing to land degradation. Meanwhile, the accompanying table meticulously outlines the specific causes of land degradation across diverse regions.
On a global scale, it becomes unequivocally clear that deforestation and overgrazing stand out as the predominant catalysts driving the deterioration of agricultural land. In particular, Europe emerged as the region experiencing the most extensive land degradation in the year 1990.
Delving deeper into the data, deforestation constitutes a significant 30% of land degradation, while overgrazing claims a substantial 35%, unequivocally earning their status as the primary culprits behind diminishing land quality. Overcultivation, with its 28% contribution, also significantly impacts land degradation, with other factors collectively representing 7%.
When dissecting the regional context, Europe grapples primarily with land degradation due to deforestation and over-cultivation. Conversely, North America faces degradation stemming from over-cultivation and overgrazing, while Oceania’s agricultural land degradation is predominantly attributed to overgrazing, with deforestation playing a minor role.
Tips for IELTS Writing Task 1 Combination Charts:
Go through the secrets to mastering combination charts in IELTS Academic Writing Task 1 with these tips:
- Focus on Key Features: Remember that you have one hour to complete both writing tasks. So, prioritize the most significant data points to report within your limited time.
- Address features from each graph separately: Avoid combining data from different graphs in one paragraph.
- Comparison is Key: Analyze relationships, similarities, or differences between the data sets to showcase understanding.
- Stay Objective: Do not include personal opinions or viewpoints. Stick to reporting the data accurately and objectively.
- Use Linking Words: Connect your sentences and paragraphs using appropriate IELTS linking words and phrases. This enhances the coherence and readability of your response.
- Utilize Varied Vocabulary and Correct Grammar: Employ precise vocabulary and proper grammar structures tailored to each graph. Accuracy matters.
Remember, IELTS Academic Writing Task 1 is all about presenting data accurately and clearly. With practice and a solid understanding of these tips, you’ll be well-prepared to tackle combination charts successfully on the IELTS exam.
Also Check:
- Demand for Electricity in England- Line Graph and Pie Chart
- Percentage of Food Budget the Average Family Spent on Restaurant Meals- Pie Chart + Line Graph
- Grammar for IELTS: Advanced Comparison for IELTS Writing to Get Band 7.5 or Higher
- IELTS Writing Task 1 Multiple Graphs
- Coherence and Cohesion in IELTS Writing
- List of 20 Important Collocations for IELTS Writing to Help Increase your Word Power
- IELTS General Training and Academic Writing Differences
Practice IELTS Writing Task 1 based on report types

Start Preparing for IELTS: Get Your 10-Day Study Plan Today!
Explore other sample Pie Charts

Janice Thompson

Janice Thompson

Janice Thompson
Recent Articles

Kasturika Samanta

Janice Thompson

Janice Thompson


Post your Comments