Percentage of Food Budget the Average Family Spent on Restaurant Meals- Pie Chart + Line Graph
Table of Contents

Limited-Time Offer : Access a FREE 10-Day IELTS Study Plan!
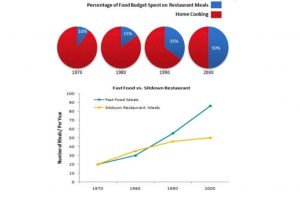
The charts below show the percentage of food budget the average family spent on restaurant meals in different years. The graph shows the number of meals eaten in fast-food restaurants and sit-down restaurants.
You should spend about 20 minutes on this task.
Write a report for a university lecturer describing the information in the graph below.
You should write at least 150 words.

Report Plan
Paraphrase: Paraphrase the topic sentence and use synonyms for the words used in the topic.
Overview: Mention the main features of the pie charts and the line graph and give an overview of the information provided.
Paragraph 1: Elaborate on the food budget patterns across different years.
Paragraph 2: Elaborate on the trend of fast food meals and restaurant meals across different years.
Sample Answer
The pie charts illustrate the spending on restaurant meals by the typical household across 4 years. The line graph represents the trend in the number of fast food and sit-down restaurant meals across four years.
The preference for dining at restaurants had significantly increased from 1970 to 2000 and the same for home-cooked meals declined. The inclination towards both fast-food and sitdown restaurants rose from 1970 to 2000 but the popularity of fast-food restaurants rose more sharply.
The expenditure on restaurants meals were only 10% in 1970 and this percentage grew gradually to 15% in 1980. By 1990 the percentage of food budget spent on restaurant meals grew significantly to 35% and by 2000, 50% of the food budget was spent in restaurants.
The number of meals per year was 20 for both fast-food and sit-down restaurants in 1970. Although the liking for sit-down restaurants grew more than fast-food restaurants initially, the preferences reversed after 1990. Fast food grew sharply whereas that of sitdown restaurants grew at a relatively slower rate.
Practice IELTS Writing Task 1 based on report types

Start Preparing for IELTS: Get Your 10-Day Study Plan Today!
Explore other sample Line Graphs

Janice Thompson

Janice Thompson

Janice Thompson
Recent Articles

Kasturika Samanta

Janice Thompson

Janice Thompson


Post your Comments