Explore other sample Tables
Sales at a Small Restaurant in a Downtown Business District- Table
The table below shows the sales at a small restaurant in a downtown business district. Summarise the information by selecting and reporting the main features, and make comparisons where relevant. You should spend about 20 minutes on this task. You should write at least 150 words. Monday Tuesday Wednesday Thursday Friday Saturday Sunday Lunch $2,400 $2,450 $2,595 $2,375 $2,500 $1,950 $1,550 Dinner $3,623 $3,850 $3,445 $3,800 $4,350 $2,900 $2,450 Report Plan Paraphrase: Paraphrase the topic sentence. Shows>represents Sales at a small restaurant>vending Overview: Mention the main features of the table and the information in the table. Paragraph 1: Elaborate on...

1 min read
Updated On
Number of Medals Won by the Top Ten Countries in the London 2012 Olympic Games- Table
The table below shows the number of medals won by the top ten countries in the London 2012 Olympic Games. You should spend about 20 minutes on this task. Summarise the information by selecting and reporting the main features, and make comparisons where relevant. Write at least 150 words. Report Plan Paraphrase: Paraphrase the topic sentence using synonyms. Overview: Mention the main features of the table and give an overview of the information provided. Paragraph 1: Elaborate on the London 2012 Olympic Games Medal Table. Paragraph 2: Elaborate on the London 2012 Olympic Games Medal Table. Sample Answer The given...

1 min read
Updated On
Cinema Viewing Figures for Films by Country, in Millions- Table
The table below shows the cinema viewing figures for films by country, in millions. You are advised to spend about 20 minutes on this task. Summarise the information by selecting and reporting the main features, and make comparisons where relevant. You should write at least 150 words. Cinema viewing figures for films by country, in millions Report Plan Paraphrase: Paraphrase the topic sentence and use synonyms. Overview: Mention the main features of the table and give an overview of the information provided. Paragraph 1: Elaborate on the trends in cinema viewing across different countries. Paragraph 2: Elaborate on the trends...

1 min read
Updated On
IELTS Academic Writing Task 1 Topic : Oil production capacity – Bar graph
Oil production capacity Summarise the information by selecting and reporting the main features, and make comparisons where relevant. Write at least 150 words. [do_widget id=custom_html-47] Report Plan Paraphrase: make comparisons>compares Overview: The graph compares possible oil production capabilities of six Gulf countries from 1990 to 2010. Paragraph 2: (1) compare the figures of the countries throughout the period. Give figures. Paragraph 3: (1) compare the figures of the remaining countries throughout the period. Give figures. Paragraph 4: (1) compare the figures of the countries throughout the period. Give figures. Conclude the given topic. Sample AnswerThe graph compares possible oil production...

2 min read
Updated On
The Situation of Marriage and Age from 1960 to 2000 in Australia – IELTS Writing Task 1
Table of Contents[Show] Question Structure Breakdown Band 7 Sample Answer For Writing Task 1 Table – The Situation of Marriage and Age from 1960 to 2000 in Australia Band 8 Sample Answer For Writing Task 1 Table – The Situation of Marriage and Age from 1960 to 2000 in Australia Band 9 Sample Answer For Writing Task 1 Table – The Situation of Marriage and Age from 1960 to 2000 in Australia Connectors Used in the Above Sample Answers of ‘The Situation of Marriage and Age from 1960 to 2000 in Australia’ In IELTS Writing Task 1 of the academic...

4 min read
Updated On
Information About Underground Railway Systems in Six Cities – IELTS Writing Task 1
In the IELTS Academic Writing Task 1, candidates are often presented with a question that will showcase a table like the ‘Information About Underground Railway Systems in Six Cities.’ Describing a table in IELTS is the same as describing a bar graph. In this, you need to compare and contrast the data that is given. While writing, we need to ensure the table chart vocabulary and that it is unique and engaging. Let’s now have a look at the table – ‘Information About Underground Railway Systems in Six Cities’ – with three expert-curated sample answers for different IELTS band scores...

4 min read
Updated On
Past And Projected Population Figures In Various Countries – IELTS Writing Task 1
The table below gives information about past and projected population figures in various countries for different years.Summarise the information by selecting and reporting the main features, and make comparisons where relevant. In IELTS Writing Task 1 of the academic section, there will be a visual representation of a table, like ‘Past And Projected Population Figures In Various Countries’ which you have to write a report about. Describing a table in IELTS is the same as describing a bar graph. In the IELTS Writing Task 1 table chart question, you need to compare and contrast the data that is given. While...

4 min read
Updated On
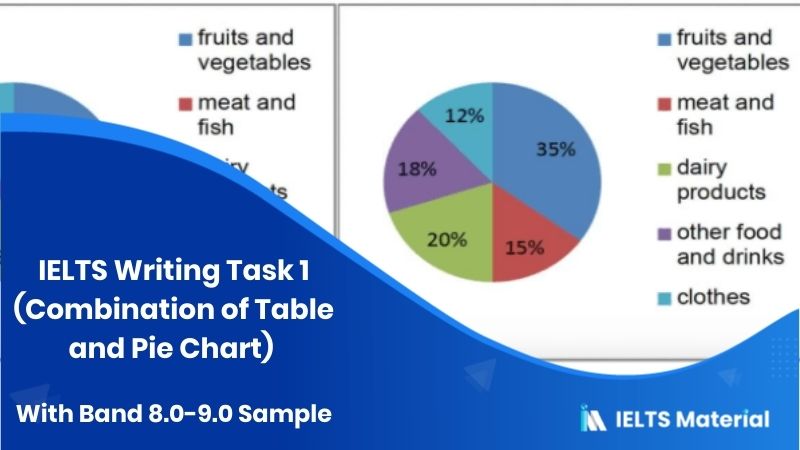
IELTS Academic Writing Task 1 Topic : Household income and spending on food and clothes
In IELTS Writing Task 1 of the academic section, there will be a visual representation or a diagram on which you have to write a paragraph. One of these visual representations may be a pie chart. Given below is an example of an IELTS Writing Task 1 pie chart discussing household income and spending on food and clothes by an average family in a UK city within a period. Let’s understand how to frame the essay from the ideas we have. The information below gives details about household income and spending on food and clothes by an average family in...

3 min read
Updated On
Changes in Modes of Travel in England Between 1985 and 2000- IELTS Writing Task 1 (Table)
Describe Image is one of the most complicated tasks in the IELTS Writing module. Without a sound plan, it can be difficult to perform well on the Describe Image exercise. An example of this question type is a table. Tables are used to display text, numbers, or symbols—or a combination of these—in columns or boxes to show a group of facts and their connections. The table below gives information about changes in modes of travel in England between 1985 and 2000. You should spend about 20 minutes on this task. Describe the information in the table and make comparisons where...

2 min read
Updated On
IELTS Academic Writing Task 1 Topic 05: Size of US households over a number of years
You should spend about 20 minutes on this task. The table below gives statistics about the size of US households over a number of years. (Household = all the people living together in one house). Study the information and answer the question. Write a short report for a university lecturer describing the information shown below. Write at least 150 words. US household by size 1790-1990 Year Per cent distribution of number of households Average population per household 1 person 2 person 3 person 4 person 5 person 6 person 7 person 1790 3.7% 7.8% 11.7% 13.9% 13.9% 13.2 35.8%...

2 min read
Updated On
IELTS Table Chart : How to describe a table in IELTS writing task 1?
You must be able to comprehend, interpret, and express a variety of diagrams on the IELTS Writing Task 1 exam, including flowcharts and statistics graphs. You must choose the image’s key elements and write a report on them in order to accomplish this. Such inquiries could be compared to news pieces that seek to present facts honestly. IELTS Writing task 1 table Tables in IELTS are also called table charts. Describing a table in IELTS is the same as describing the bar graph. In the IELTS writing task 1 table chart question, you need to compare and contrast the data...

4 min read
Updated On
IELTS Academic Writing Task 1 Topic 12: Internet use in six categories by age group – Table
Writing tasks in the IELTS can be difficult for many Aspirants who are not used to writing long-form English language text. Thus, it is vital that you polish your writing skills before attempting the IELTS. Are you preparing for the IELTS and concerned about how to approach topics such as the IELTS Table Chart in the Writing section? To be honest, the IELTS Table Chart Writing section is simple. All you have to do is accurately identify the data and organize it in a summary format within 150 words. So, understand the process, learn some vocab and practice harder with...

2 min read
Updated On
IELTS Academic Writing Task 1 Topic : Amount of money given in aid of developing countries – Table
The table shows the amount of money given in aid of developing countries’ technology by charities in the US, EU, and other countries from 2006 to 2010. Report Plan Paraphrase: illustrates; the amount of money>how much money; given>donated; from 2006 to 2010>in the period 2006 to 2010. Summary/overview paragraph: (1) total aid increased (2) US charities gave most money. Paragraph 3: the trend for total aid; share of total aid from US charities. Paragraph 4: compare trends for aid from the EU and other countries. Sample Answer The table illustrates the total amount of donations made by the US, UK,...

2 min read
Updated On
IELTS Academic Writing Task 1 Topic 15: Average length of YouTube video advertisements – Table
The table shows the average length of YouTube video advertisements and an average length of time viewers spend watching them. Summarise the information by selecting and reporting the main features. Write at least 150 words. Average YouTube Video ad length and time viewed Type of YouTube ad The average length of YouTube ad (seconds) Average time viewed(seconds) Public service 66.7 28.1 Business and finance 35.1 24.6 Entertainment and news 30.8 26.5 Travel 28.7 23.0 Technology 39.3 20.9 Retail 26.5 20.1 Consumer electronics 24.9 17.3 Clothing 23.4 16.6 Pharmaceuticals 21.8 16.0 Lifestyle 33.7 14.3 Overall 38.1 20.4 Report Plan Paraphrase: depicts;...

2 min read
Updated On
IELTS Academic Writing Task 1 Topic : Visitor statistics for 1996,1998 and 2000 – Table
The table below gives information on visitor statistics for 1996,1998 and 2000 for various World Heritage sites in Australia. Report Plan Paraphrase: Shows/Illustrates; the total number of visitors visiting the six world heritage sites in Australia from 1996 to 2000. Overview/Summary: 1) Tourist sites which saw an upward trend. 2) the most attractive and least visited sites. Paragraph 3: Increase of Tourists in Great Barrier Reef Give figures. Paragraph 4: Visitors in Central Eastern Rainforest Reserve and the Blue Mountains. Give figures. Paragraph 5: Compare the figures of tourists in Tasmania, Shark Bay, and Macquarie Island. Sample Answer The table...

2 min read
Updated On
IELTS Academic Writing Task 1: Social and economic indicators for four countries – Table
The table below shows social and economic indicators for four countries in 1994, according to United Nations statistics. Summarise the information by selecting and reporting the main features, and make comparisons where relevant. Write at least 150 words. Report Plan Paraphrase: shows>compares; social and economic indicators for four countries >socio-economic pointers Overview: The available table compares UN data on socio-economic pointers in 1994 for four countries, namely Japan, Canada, Peru, and Zaire. Paragraph 2: (1) Talk about the highest and the lowest indicators. Paragraph 3: (1) Talk about different indicators of the given countries. Give figures. Paragraph 4: (1)...

2 min read
Updated On
IELTS Academic Writing Task 1 Topic 39: Alcohol related deaths 2005 and average beer consumption – Table
Summarise the information by selecting and reporting description of the correlation of the table that follow.Write at least 150 words. Report Plan Paraphrase: correlation of the table >the table shows a clear correlation Overview: The table shows a clear correlation between the litres of beer consumed per capita and the number of alcohol-related deaths. Paragraph 2: (1) Compare the alcohol-consumption statistics and the death rates in given countries. Give figures. Paragraph 3: (1) Compare the alcohol-consumption statistics and the death rates in given countries. Give figures. Sample Answer The table shows a clear correlation between the litres of beer consumed...

2 min read
Updated On
IELTS Academic Writing Task 1 Topic 35: Number of travelers using three major German airports – Table
You should spend about 20 minutes on this task.The table below highlights data on the number of travelers using three major German airports between 2007 and 2012. Summarize the information by selecting and reporting the main features, and make comparisons where relevant.Write at least 150 words. Airport visitors, 2007-2012 (millions of travelers per year) Report Plan Paraphrase: highlights data>shows information; on the number of travelers using three major German airports>about how many people visited Germany through three major airports Overview: The table highlights data on the number of travelers using three major German airports. Paragraph 2: (1) Give the gist...

2 min read
Updated On
IELTS Academic Writing Task 1 Topic 25: Changes in modes of travel in Netherland – Table
The table below gives information about changes in modes of travel in Netherland between 2001 and 2006.Describe the information in the table and make comparisons where appropriate.Write at least 150 words. Report Plan Paraphrase: gives information>demonstrates; changes in modes of travel in Netherland>the difference between the average distance travelled by numerous transportation modes in Netherland Overview: The chart illustrates average distance travelled by various modes of transport in Netherland in 2001 and 2006. Paragraph 2: (1) Compare the statistics of different modes in detail. Give figures. Paragraph 3: (1) Compare the statistics of different modes in detail. Give figures. Sample...

2 min read
Updated On
IELTS Academic Writing Task 1 Topic 16: Journeys made by different forms of transport in four countries. – Table
The table shows the percentage of journeys made by different forms of transport in four countries, The bar graph shows the results of a survey into car use. Summarise the information by selecting and reporting the main features, and make comparisons where relevant. Write at least 150 words. Journeys made by Canada Belgium Germany Netherlands Car 90% 72% 68% 47% Bicycle 1% 2% 2% 26% Public transport 3% 12% 18% 8% On foot 5% 11% 11% 18% Other 1% 3% 1% 1% Report Plan Paraphrase: shows>helps compare; journeys made by different forms of transport>modes of transport used Overview: The table...

2 min read
Updated On

