Explore other sample Bar Charts
USA Marriage and Divorce Rates Between 1970 and 2000 and the Marital Status of Adult Americans- Bar Graph
Describe Image is one of the most complicated tasks in the IELTS Writing module. Without a sound plan, it can be difficult to perform well on the Describe Image exercise. The Bar Graph is the ideal format for practising the Describe Image problem because it has logically and simply organised all of the components. Elements of the Bar Graph include the layout, the figures, the contrasts, and the similarities. The charts below give information about USA marriage and divorce rates between 1970 and 2000 and the marital status of adult Americans in two of the years. You should spend about...

2 min read
Updated On
Rural Households that Had Internet Access Between 1999 and 2004- Bar Graph
The graph below shows the percentage of urban/suburban and rural households in a European country that had Internet access between 1999 and 2004. You should spend about 20 minutes on this task. Summarize the information by selecting and reporting the main features, and make comparisons where relevant. You should write at least 150 words. Report Plan Paraphrase: Paraphrase the topic sentence. Overview: Mention the main features of the bar graph and give an overview of the information provided. Paragraph 1: Elaborate on the trends of household internet usage in a European country. Paragraph 2: Elaborate on the trends of household...

1 min read
Updated On
Top Ten Rice-Producing Countries in the World in 2015- Bar Graph
The bar chart below provides information about the top ten rice-producing countries in the world in 2015. You should spend about 20 minutes on this task. Summarise the information by selecting and reporting the main features and making comparisons where relevant. Write at least 150 words. Top ten rice producers in the world in 2015 Report Plan Paraphrase: Paraphrase the topic sentence using synonyms. Overview: Mention the main features of the bar graph and give an overview of the information provided. Paragraph 1: Elaborate on the information about the top ten rice-producing countries in the world in 2015. Paragraph 2:...

1 min read
Updated On
Number of Computer and Internet users in Different Arab Countries- Bar Graph
The graph below shows the number of Computer and Internet users in different Arab countries. You should spend about 20 minutes on this task. Write a report describing the information in the graph below. You should write at least 150 words. Computer and the Internet in the Arab World Report Plan Paraphrase: Paraphrase the topic sentence using synonyms. Overview: Mention the main features of the bar graph and give an overview of the information provided. Paragraph 1: Elaborate on the use of computers and the Internet in the Arab world. Paragraph 2: Elaborate on the use of computers and the...

1 min read
Updated On
Amount of Money Per Week Spent on Fast Food in Britain- Bar Graph + Line Graph
The chart below shows the amount of money per week spent on fast food in Britain. The graph shows the trends in the consumption of fast foods. You should spend about 20 minutes on this task. Write a report for a university lecturer describing the information shown below. You should write at least 150 words. Expenditure (Pence per person) on Fast Food, by Income Groups, UK 1990 Consumption of fast food per person in gram in Britain. Report Plan Paraphrase: Paraphrase the information in the topic sentence. Overview: Mention the main features from both the graphs and give an...

1 min read
Updated On
Amount of Leisure Time Enjoyed by Men and Women of Different Employment Statuses – Bar Chart
The chart below shows the amount of leisure time enjoyed by men and women of different employment statuses. You should spend about 20 minutes on this task. Write a report for a university lecturer describing the information below. You should write at least 150 words. Leisure time in a typical week in hour – by sex and employment status, 1998-99. Report Plan Paraphrase: Paraphrase the topic sentence. Overview: Mention the main features of the bar graph and give an overview of the information provided. Paragraph 1: Elaborate on the pattern of leisure time enjoyed by men and women of different...

1 min read
Updated On
Annual Pay for Doctors and Other Workers - IELTS Academic Writing Task 1 Bar Chart
In the IELTS Writing Task 1, a bar graph presents data using bars to compare different categories. Your task is to summarize the main trends, describe specific data points, and make comparisons between categories. You should focus on providing a clear overview, detailing significant differences or similarities, and using accurate data references for the IELTS Writing task 1 Bar Chart. Describing images in the IELTS Writing module can be challenging without a good plan. Practicing with bar graphs is helpful because they are organized clearly and logically. Key elements to focus on include the layout, figures, comparisons, and similarities. Task...

2 min read
Updated On
Division of Household Tasks by Gender in Great Britain- Bar Graph
In the IELTS Writing Task 1, a bar graph presents data using bars to compare different categories. Your task is to summarize the main trends, describe specific data points, and make comparisons between categories. You should focus on providing a clear overview, detailing significant differences or similarities, and using accurate data references for the IELTS Writing task 1 Bar Chart. Describing images in the IELTS Writing module can be challenging without a good plan. Practicing with bar graphs is helpful because they are organized clearly and logically. Key elements to focus on include the layout, figures, comparisons, and similarities. The...

2 min read
Updated On
Estimated World Illiteracy Rates by Region and by Gender – IELTS Writing Task 1
The candidates for IELTS Academic Writing are often presented with a bar chart like ‘Estimated World Illiteracy Rates by Region and by Gender’ on which you will be writing a report. Such a bar chart also comes with two axes, showing changes and diversifications over a given period. Furthermore, the bar graph has rectangular bars that could be either displayed vertically or horizontally, representing two or more values of data. Elements of the bar chart include the layout, the figures, the contrasts, and the similarities. Let’s have a look at the bar chart – ‘Estimated World Illiteracy Rates by Region...

4 min read
Updated On
Southland’s Main Exports in 2000 and Future Projections For 2025 – IELTS Writing Task 1
In IELTS Academic Writing, candidates are often presented with a process diagram that illustrates a sequence of events or steps involved in a particular bar chart like ‘Southland’s Main Exports in 2000 and Future Projections For 2025.’ Sometimes, in the IELTS examination, amidst all the other types of questions, you will also come across a question that will showcase a bar graph. Also known as a bar chart, this question type is evaluated similarly to a line graph. Such a bar chart also comes with two axes, showing changes and diversifications over a given period. Furthermore, the bar graph has...

5 min read
Updated On
Carbon Emissions in Different Countries – IELTS Writing Task 1
In IELTS Writing Task 1 of the academic section, there will be a visual representation like ‘Carbon Emissions in Different Countries’ which you have to write a report about. Sometimes, in the IELTS examination, amidst all the other types of questions, you will also come across a question that will showcase a bar graph. Also known as a bar chart, this question type is evaluated similarly to a line graph. Such a bar chart also comes with two axes, showing changes and diversifications over a given period. Furthermore, the bar graph has rectangular bars that could be either displayed vertically...

5 min read
Updated On
IELTS Academic Writing Task 1 Topic 11: Different methods of waste disposal in four cities – Bar Chart
Describe Image is one of the most complicated tasks in the IELTS Writing module. Without a sound plan, it can be difficult to perform well on the Describe Image exercise. The Bar Chart is the ideal format for practising the Describe Image problem because it has logically and simply organised all of the components. Elements of the Bar Chart include the layout, the figures, the contrasts, and the similarities. You should spend about 20 minutes on this task.The bar chart shows different methods of waste disposal in four cities; Toronto, Madrid, Kuala Lumpur and Amman. Summarize the information by describing...

3 min read
Updated On
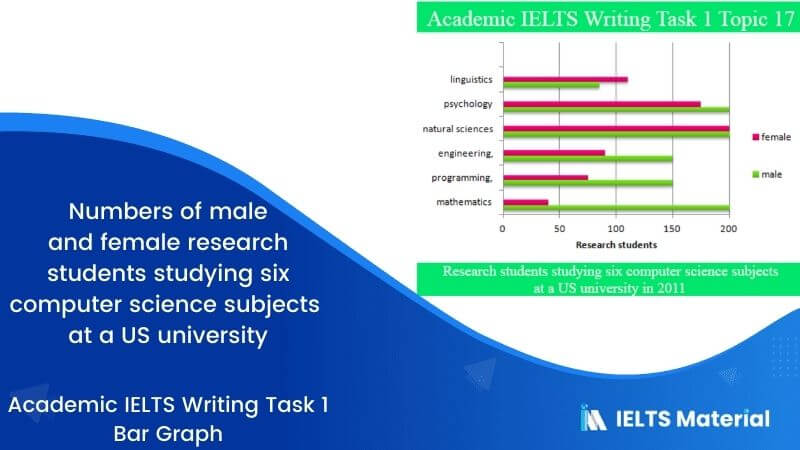
IELTS Academic Writing Task 1 Topic 17: Numbers of male and female research students studying six computer science subjects at a US university – Bar Graph
Describe Image is one of the most complicated tasks in the IELTS Writing module. Without a sound plan, it can be difficult to perform well on the Describe Image exercise. The Bar Graph is the ideal format for practising the Describe Image problem because it has logically and simply organised all of the components. Elements of the Bar Graph include the layout, the figures, the contrasts, and the similarities. The bar graph below shows the numbers of male and female research students studying six computer science subjects at a US university in 2011.Summarise the information by selecting and report in...

3 min read
Updated On
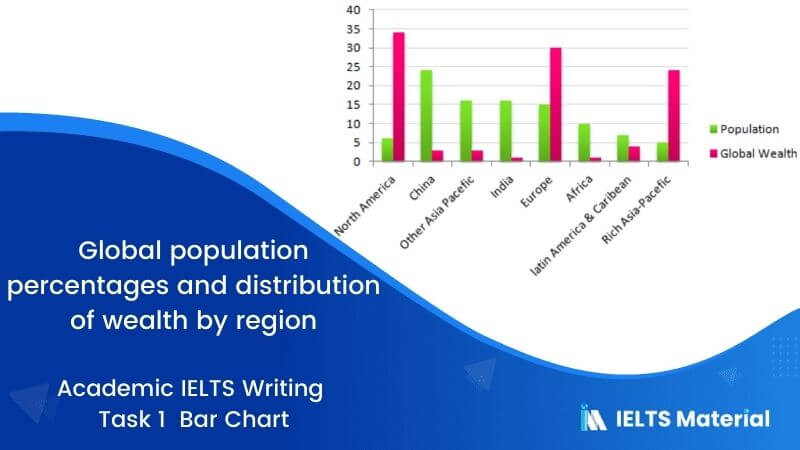
IELTS Academic Writing Task 1 Topic 06: Global population percentages and distribution of wealth – Bar chart
Describe Image is one of the most complicated tasks in the IELTS Writing module. Without a sound plan, it can be difficult to perform well on the Describe Image exercise. The Bar Graph is the ideal format for practising the Describe Image problem because it has logically and simply organised all of the components. Elements of the Bar Graph include the layout, the figures, the contrasts, and the similarities. You should spend about 20 minutes on this task.The chart below gives information about global population percentages and distribution of wealth by region. Summarise the information by selecting and reporting the...

2 min read
Updated On
IELTS Writing Task 1 Test On 28th July With Band 8.0-9.0 Sample
Describe Image is one of the most complicated tasks in the IELTS Writing module. Without a sound plan, it can be difficult to perform well on the Describe Image exercise. The Bar Graph is the ideal format for practising the Describe Image problem because it has logically and simply organised all of the components. Elements of the Bar Graph include the layout, the figures, the contrasts, and the similarities. The bar chart below shows the percentage of people living alone in 5 different age groups in the USA between 1850 and 2000. Report Plan Paraphrase paragraph: shows>compares percentage>proportion of people...

3 min read
Updated On
IELTS Academic Writing Task 1 Topic : People affected by four types of noise pollution – Bar graph
In IELTS Writing Task 1 of the Academic section, there will be a visual representation or a diagram on which you have to write a paragraph. One of these visual representations may be bar graphs. Given below is an example of an IELTS Writing Task 1 bar graph discussing the number of people who are affected by four types of noise day on a daily basis in cities and rural areas in 2007. Let’s understand how to frame the essay from the ideas we have. The charts illustrate the number of people affected by four types of noise pollution day...

3 min read
Updated On
IELTS Academic Writing Task 1 Topic 22: Railway system in six cities in Europe – Bar Chart
In the Writing Task 1 of the IELTS Academic test, you are required to write a report on diagrams such as IELTS bar charts, pie graphs, line graphs, processes, etc in at least 150 words. So, the IELTS bar chart/diagram based on Railway system in six cities in Europe and its sample explanation will provide an insight into the format and type of vocabulary to be used in similar cases. The bar charts below give information about the railway system in six cities in Europe. Summarise the information by selecting and reporting the main features, and make comparisons where relevant....

3 min read
Updated On
IELTS Bar Chart/Graph – Samples, Tips to Describe Bar Graphs
Amidst all the other types of questions, you will also come across a question that will showcase a bar graph. Also known as a bar chart, the bar graph is evaluated similar to a line graph. Such a bar chart also comes with two axes, showing changes and diversifications over a given period of time. Furthermore, the bar graph has rectangular bars that could be either displayed vertically or horizontally, representing two or more values of data. Types of IELTS Bar Graphs When preparing for the IELTS exam, you would have to prepare for two different types of bar graphs:...

4 min read
Updated On
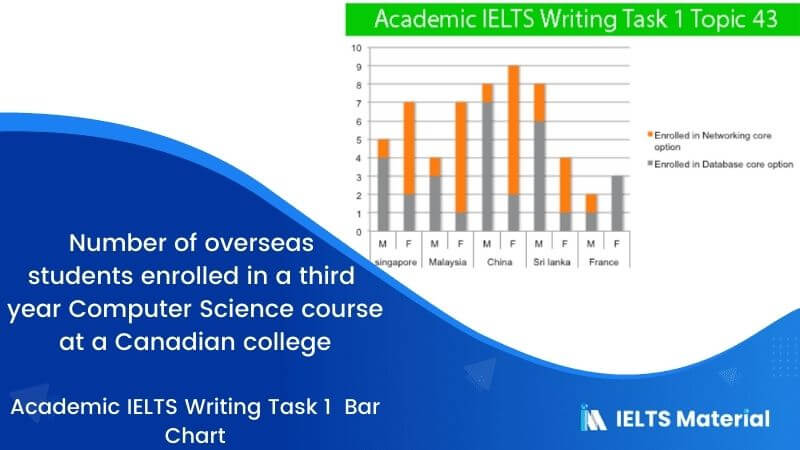
IELTS Academic Writing Task 1 Topic 43: Number of overseas students enrolled – Bar chart
The bar chart shows the number of overseas students enrolled in a third year Computer Science course at a Canadian college. Summarise the information by selecting and report in the main features, and make comparisons where relevant. Write at least 150 words. Report Plan Paraphrase: bar chart>illustration; overseas students>students from four Asian countries Overview: The graph depicts students from four Asian countries, taking Computer Science at the collage. Paragraph 2: (1) compare the number of students enrolled in different countries. Give figures. Paragraph 3: (1) compare the number of students enrolled in the remaining countries. Give figures. Paragraph 4: (1)...

2 min read
Updated On
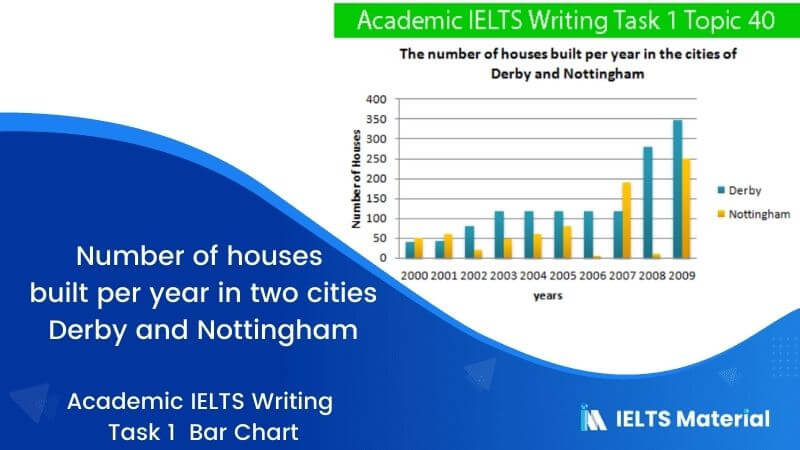
IELTS Academic Writing Task 1 Topic 40: Number of houses built per year in two cities Derby and Nottingham – Bar Chart
The bar chart below shows the number of houses built per year in two cities, Derby and Nottingham, Between 2000 and 2009.Write a report for a university lecturer describing the information shown below.Write at least 150 words. Report Plan Paraphrase: shows>outlines; number of houses built per year >number of houses constructed annually Overview: The bar graph outlines the drinking pattern of Americans based on their age groups. Paragraph 2: (1) compare the number throughout different periods. Give figures. Paragraph 3: (1) compare the number throughout different periods. Give figures. Sample Answer The given chart outlines the number of houses constructed...

2 min read
Updated On


