The table and charts below give information on the police budget – IELTS Writing Task 1
6 min read
Updated On
-
Copy link
Table of Contents
- Question
- Structure Breakdown
- Band 7 Sample Answer for Writing Task 1 Question – The table and charts below give information on the police budget
- Band 8 Sample Answer for Writing Task 1 Question – The table and charts below give information on the police budget
- Band 9 Sample Answer for Writing Task 1 Question – The table and charts below give information on the police budget
- IELTS Writing Task 1 connectors used in the sample answers for the table and charts below give information on the police budget
- Additional Resources

Limited-Time Offer : Access a FREE 10-Day IELTS Study Plan!
In the IELTS Academic Writing Task 1, you are often required to interpret and present information from charts, graphs, tables or a combination of any of these two as in the topic – The table and charts below give information on the police budget for 2017 and 2018 in one area of Britain – IELTS Writing Task 1 – from Cambridge IELTS 17 Test 2.
Mastering IELTS Writing Task 1 requires a strategic approach to interpreting data accurately and expressing findings coherently. By systematically analyzing the police budget data for 2017 and 2018 in a British region, you can hone their skills in presenting complex information with clarity and precision. If you want to perfect your writing skills for Academic Writing Task 1, make sure to use the writing practice tests.
Let’s have a look at the Combination Graph – ‘The table and charts below give information on the police budget for 2017 and 2018 in one area of Britain,’ with three expert-curated sample answers for different IELTS band scores ranging from band 7-9.
Question
You should spend about 20 minutes on this task.
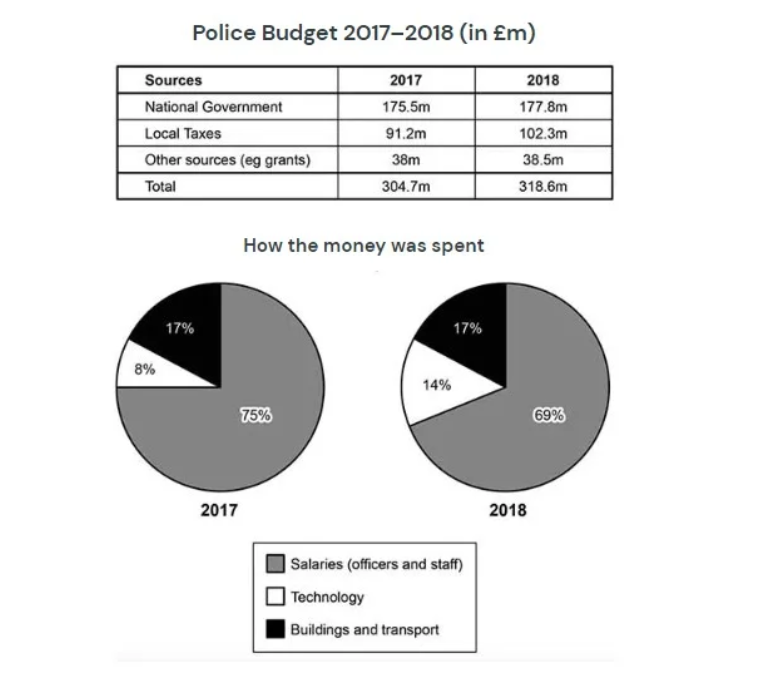
The table and charts below give information on the police budget for 2017 and 2018 in one area of Britain. The table shows where the money came from and the charts show how it was distributed.
Summarise the information by selecting and reporting the main features, and make comparisons where relevant.
Write at least 150 words.
Structure Breakdown
| Type – Combination Chart (Table & Pie Chart)
Introductory Paragraph
Overview
Body Paragraph 1
Body Paragraph 2
Note: You can mix the comparison between the two visuals in the body paragraphs. Make sure to use connectors appropriately. |
Want to get your answer on ‘The table and charts below give information on the police budget – IELTS Writing Task 1’ assessed?
Get Evaluated for FREE!
Band 7 Sample Answer for Writing Task 1 Question – The table and charts below give information on the police budget
The table and pie charts show information about the police budget in a specific area of Britain for 2017-18. The table tells us where the money comes from, and the pie charts show how it is spent.
Overall, the police budget went up, and in both 2017 and 2018, the national government gave the most money. Salaries were the main thing the money was spent on during this time.
In 2017, the police operated with a total budget of £304.7 million, experiencing a notable increase to £318.6 million in 2018. The primary contributor to this budget was the national government, with their funding rising from £175.5 million to £177.8 million. Among all funding sources, local taxes witnessed the most substantial growth, surging from £91.2 million to £102.3 million. Additionally, other funding sources contributed £38.5 million to the overall budget in 2018, reflecting a £0.5 million increase compared to the previous year.
The main expenses were related to salaries for officers and staff, although their share decreased from 75% to 69% of the total. Notably, spending on technology nearly doubled, rising from 8% to 14%. Meanwhile, the allocation for buildings and transport remained steady at 17%. (202 words)
Looking to improve your IELTS Writing skills?
Sign up for a free session with our expert instructors today!
Band 8 Sample Answer for Writing Task 1 Question – The table and charts below give information on the police budget
The presented table details the funding sources for the police force in a specific British region, while the accompanying pie charts visually depict the distribution of this budget for the years 2017 and 2018.
Broadly speaking, there is a noticeable upward trend in funding from all sources, notably with a substantial surge in contributions from local taxes. Regarding expenses, salaries remained the primary focus of the budget, although there was a distinct rise in funding for technology. In particular, there were no alterations in the budget allocations for buildings and transport.
Specifically, the government’s contribution was £175.5 million in 2017 and slightly increased to £177.8 million in 2018. In contrast, local taxes experienced a significant boost from £91.2 million to £102.3 million. Funding from other sources, including grants, saw a modest uptick from £38 million to £38.5 million. Consequently, the overall budget showed an increase of £13.9 million, reaching a total of £318.6 million in 2018.
In terms of budget distribution, salaries comprised 75% of the total budget in 2017, but this proportion decreased to 69% in 2018. In contrast, funding designated for technology nearly doubled, rising from 8% to 14%. Expenditure for buildings and transport remained steady at 17% in both years. (209 words)
Want a comprehensive guide to get the band score you need in IELTS Writing Task 1?
Band 9 Sample Answer for Writing Task 1 Question – The table and charts below give information on the police budget
Unlock Answer
On the whole, the primary funding source was the national government, with salaries for officers and staff representing the most substantial expenditure. Despite a slight reduction in the percentage allocated to salaries, it remained the highest expenditure.
The national government played a pivotal role in financing the police force, contributing over half of the total budget in both 2017 (£175.5 million) and 2018 (£177.8 million). Local taxes contributed £91.2 million in 2017 and rose to £102.3 million in 2018, while other sources saw a marginal increase from £38 million to £38.5 million.
Regarding expenditure, salaries consistently ranked as the highest expense, decreasing from 75% in 2017 to 69% in 2018. Notably, technology funding experienced a significant surge, rising from 8% in 2017 to 14% in 2018. Allocations for buildings and transport remained stable at 17% of the budget in both years. (168 words)
IELTS Writing Task 1 connectors used in the sample answers for the table and charts below give information on the police budget
Connectors, also known as connectives or transition words, are words or phrases that link ideas or parts of a sentence or paragraph together. Here are some of the connectors used in the above sample answers of the table and charts giving information on the police budget:
- Overall/On the whole
- Additionally
- Notably
- Meanwhile
- Broadly speaking
- In particular
- Specifically
- In contrast
- Consequently
In the end, do not forget to proofread your answers carefully and use effective strategies for analysis of the combination charts like in ‘The table and charts below give information on the police budget for 2017 and 2018 in one area of Britain’ are crucial for success in IELTS Writing Task 1.
Additional Resources
- How to Answer a Combination Chart in Writing Task 1?
- IELTS Academic Writing Task 1 Topic : Newly graduated students in the UK and their proportions – Multiple Graphs
- IELTS Writing Task 1 – Mixed Charts
- Get a 7.0+ for IELTS Writing Task 1 by Using 6 Sentence Structures to Compare Numbers
- IELTS Academic Writing Task 1 Topic: Percentage of people living alone in 5 different age groups in the US – Bar Chart
Practice IELTS Writing Task 1 based on report types

Start Preparing for IELTS: Get Your 10-Day Study Plan Today!
Explore other Writing Actual Tests

Kasturika Samanta
Recent Articles

Kasturika Samanta

Janice Thompson

Janice Thompson




Post your Comments