Weekday Volume of Passenger Activity on the Toronto Metro system- Line Graph
Table of Contents

Limited-Time Offer : Access a FREE 10-Day IELTS Study Plan!
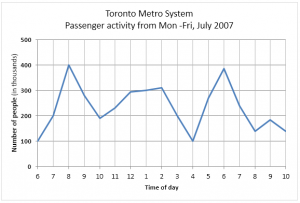
The graph below shows the weekday volume of passenger activity on the Toronto Metro system for July 2007.
You should spend about 20 minutes on this task
Summarize the information by selecting and reporting the main features, and make comparisons where relevant.
You should write at least 150 words.

Report Plan
Paraphrase: Paraphrase the topic sentence using synonyms.
Overview: Mention the main features of the line graph and give an overview of the information provided.
Paragraph 1: Elaborate on the weekday volume of passenger activity on the Toronto Metro system for July 2007.
Paragraph 2: Elaborate on the weekday volume of passenger activity on the Toronto Metro system for July 2007.
Sample Answer
The line graph illustrates the number of people that use the Toronto metro system at different times of day for the month of July 2007.
The volume of passenger activity in the Toronto metro system in July 2007 was very erratic. The number of passengers peaked twice a day and the number dropped a few times.
The highest number of passengers that availed the Toronto metro system was 400 thousand when it was at 8 AM. The passenger activity dropped a little below 200 thousand people at 10 AM before it started rising again. The number of passengers reached a little over 300 thousand at 2 PM before falling dramatically at 4 PM to 100 thousand passengers.
The number of passengers peaked again at 6 PM and reached almost 400 thousand again. After 6 PM there was a sharp drop in the number of passengers, apart from a small peak at 9 PM, after which it fell again.
Practice IELTS Writing Task 1 based on report types

Start Preparing for IELTS: Get Your 10-Day Study Plan Today!
Explore other sample Line Graphs

Janice Thompson

Janice Thompson

Janice Thompson
Recent Articles

Kasturika Samanta

Janice Thompson

Janice Thompson


Post your Comments