The Percentage Of The Population In Four Asian Countries – IELTS Writing Task 1
4 min read
Updated On
-
Copy link
Table of Contents
- Question
- Structure Breakdown
- Band 7 Sample Answer For Writing Task 1 Line Graph – ‘The Graph Below Gives Information About The Percentage Of The Population In Four Asian Countries’
- Band 8 Sample Answer For Writing Task 1 Line Graph – ‘The Graph Below Gives Information About The Percentage Of The Population In Four Asian Countries’
- Band 9 Sample Answer For Writing Task 1 Line Graph – ‘The Graph Below Gives Information About The Percentage Of The Population In Four Asian Countries’
- Connectors Used in the Above Sample Answers of ‘The Graph Below Gives Information About The Percentage Of The Population In Four Asian Countries’
- Useful Links:

Limited-Time Offer : Access a FREE 10-Day IELTS Study Plan!
In IELTS Writing Task 1 of the academic section, there will be a visual representation like ‘The Graph Below Gives Information About The Percentage Of The Population In Four Asian Countries’ which you have to write a report about.
Sometimes, in the IELTS examination, you are asked to explain a line graph. The IELTS line graph shows how data changes over time. These line graphs will have 2 axes, one is the X-axis and another is the Y-axis. The X-axis shows the time and the Y-axis shows what is being measured. The line graph highlights the trends when the data goes up and down.
Let’s have a look at the Line Graph – ‘The Graph Below Gives Information About The Percentage Of The Population In Four Asian Countries’ – with three expert-curated sample answers for different IELTS band scores ranging from band 7-9.
Question

Structure Breakdown
| Question Type
Line Graph Introduction Paraphrase the prompt and mention the time frame. Overview Highlight key features, focusing on changes, highs, lows, and patterns. Avoid specific data details. Main Body Paragraph 1 Organize based on major trends or categories of the 1st graph. Each paragraph covers one significant aspect. Use specific data for analysis. Main Body Paragraph 2 Organize based on major trends or categories of the 2nd graph. Each paragraph covers one significant aspect. Use specific data for analysis. |
Band 7 Sample Answer For Writing Task 1 Line Graph – ‘The Graph Below Gives Information About The Percentage Of The Population In Four Asian Countries’
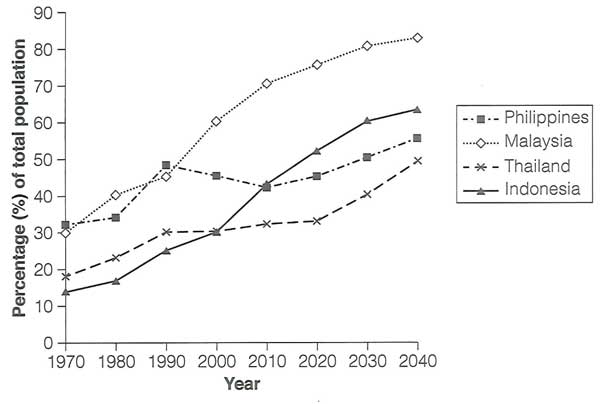
The line chart illustrates changes in urban residency across four Asian countries from 1970 to 2040 in terms of percentage.
Overall, urbanization is set to rise in all nations, with Malaysia and the Philippines showing particularly substantial increases.
By 2040, Malaysia is anticipated to have the highest urban living percentage. In 1970, the Philippines and Malaysia had comparable urban residency rates, both around 31% and 30% respectively. Thailand and Indonesia had lower rates, with Thailand at 19% and Indonesia at 12%. Over the next two decades, Malaysia’s rate fluctuated but eventually surged, surpassing the Philippines at around 40% before rapidly increasing in 1990. It is projected to exceed 80% by 2040.
Moreover, Indonesia has witnessed substantial urban residency growth, surpassing Thailand in 2000 (28%) and the Philippines in 2010 (42%). It is projected to reach 55%, the second-highest among all countries. Lastly, Thailand has undergone a gradual increase and currently stands at around 30%, with expectations to exceed 40% in the next 17 years. (163 Words)
Aspiring to Crack IELTS Writing?
Sign Up For a FREE Demo Session Now!
Band 8 Sample Answer For Writing Task 1 Line Graph – ‘The Graph Below Gives Information About The Percentage Of The Population In Four Asian Countries’
The given linear graph shows the information about the proportion of people in 4 distinct countries who were urban dwellers from 1970 to 2020, along with the projection for 2030 and 2040.
Overall, it is evident that Malaysia and the Philippines had almost the same ratio of urban residences in the initial years, whereas Malaysia is predicted to reach the first position in the last given year.
Firstly, in 1970, the highest number of inhabitants was from the Philippines (above 34%), followed by Malaysia, Thailand, and Indonesia. However, around the year 1990, the ratio of the Philippines surpassed Malaysia and came to its highest point, whereas the Philippines’ residency remained the same at the first position throughout the period, whose figure was predicted to go almost 80%.
Furthermore, the percentage of Indonesian people living in towns was the lowest in 1970. Although the number of people staying in Thailand, on the other hand, experienced an increase till 1990, it will remain less than that of the other three countries. (163 Words)
Do you have an essay on this topic?
Post it in the comment section for a FREE evaluation!
Band 9 Sample Answer For Writing Task 1 Line Graph – ‘The Graph Below Gives Information About The Percentage Of The Population In Four Asian Countries’
The line graph illustrates urban residency trends in four Asian countries – the Philippines, Malaysia, Thailand, and Indonesia, between 1970 and 2020, with additional predictions for 2030 and 2040.
Overall, Malaysia and Indonesia consistently showed the highest urban population, while the Philippines and Thailand demonstrated lower urban residency figures, which continued to decline over the years.
Regarding Malaysia, urban living steadily increased from 30% in 1970 to 70% in 2020, peaking at 80% in both 2030 and 2040, aligning with projections. Similarly, Indonesia’s urban residency rose from 12% in 1970 to 50% in 2020, maintaining this growth through 2030 and 2040 as anticipated.
Turning to the Philippines, the urban population started at 30% in 1970, reached 49% in 1990, experienced a sharp decline to 40% in 2000, and remained constant through the predicted years of 2030 and 2040. Moreover in Thailand, urban residency began at 19% in 1970, maintaining a consistent level, except for a peak at 35% in the projected year 2040. (161 Words)
Connectors Used in the Above Sample Answers of ‘The Graph Below Gives Information About The Percentage Of The Population In Four Asian Countries’
Connectors, also known as connectives or transition words, are words or phrases that link ideas or parts of a sentence or paragraph together. Here are some of the connectors used in the above sample answers:
- Overall
- Firstly
- However
- Furthermore
- Subsequently
- On the other hand
- Regarding
- Similarly
- Lastly
- Moreover
Remember to proofread your essay for grammar, vocabulary, and spelling errors. These tips, combined with practice, will help you write well-structured and coherent IELTS Writing Task 1 Line graph answers like ‘The Graph Below Gives Information About The Percentage Of The Population In Four Asian Countries.’
Useful Links:
- IELTS Academic Writing Task 1 Topic 38: Paris Metro station passengers – Line Graph
- Information about the rates of unemployment | Line Graph – IELTS Academic Writing Task 1 Practice Test 34
- IELTS Writing Practice Test 30 (Task 1 & 2) & Sample Answers
- IELTS Academic Writing Task 1 Topic: Price changes for fresh fruits and vegetables – Line Graph
- IELTS Academic Writing Task 1 Topic: International conferences in three capital cities – Line Graph
Practice IELTS Writing Task 1 based on report types

Start Preparing for IELTS: Get Your 10-Day Study Plan Today!
Explore other sample Line Graphs

Janice Thompson

Janice Thompson

Janice Thompson
Recent Articles

Kasturika Samanta

Janice Thompson

Janice Thompson


Post your Comments