Explore other sample Line Graphs
2008 Report About the Consumption of Energy in the USA since 1980- Line Graph
The graph below gives information from a 2008 report about the consumption of energy in the USA since 1980 with projections until 2030 You should spend about 20 minutes on this task. Summarise the information by selecting and reporting the main features, and make comparisons where relevant. You should write at least 150 words. Report Plan Paraphrase: Paraphrase the topic sentence. Overview: Mention the main features of the given line graph and give an overview of the information provided. Paragraph 1: Elaborate on the US Energy Consumption trends. Paragraph 2: Elaborate on the US Energy Consumption trends. Sample Answer The...

1 min read
Updated On
Waste Recycling Rates in the U.S. From 1960 to 2011- Line Graph
The graph below shows waste recycling rates in the U.S. from 1960 to 2011. You should spend about 20 minutes on this task. Summarise the information by selecting and reporting the main features, and make comparisons where relevant. You should write at least 150 words. National Recycling Rates, US, 1960 to 2011 Report Plan Paraphrase: Paraphrase the topic sentence. Overview: Mention the main features of the line graph and give an overview of the information provided. Paragraph 1: Elaborate on the total waste recovery in the U.S. from 1960 to 2011. Paragraph 2: Elaborate on the waste recycling rates in...

1 min read
Updated On
Demographic Trends in Scotland- Line Graph
The figure shows demographic trends in Scotland. You should spend about 20 minutes on this task. Summarise the information by selecting and reporting the main feature. You should write at least 150 words. Report Plan Paraphrase: Paraphrase the topic sentence using synonyms. Overview: Mention the main features of the graph and give an overview of the information provided. Paragraph 1: Elaborate on the demographic trends of Scotland. Paragraph 2: Elaborate on the demographic trends of Scotland. Sample Answer The given line graph depicts the trends in the population of Scotland from 1940 to 2020. The parameters shown in this graph...

2 min read
Updated On
Projected Population Growth of China and India- Line Graph
Describe Image is one of the most complicated tasks in the IELTS Writing module. Without a sound plan, it can be difficult to perform well on the Describe Image exercise. The Line Graph is the ideal format for practicing the Describe Image problem because it has logically and simply organized all of the components. Elements of the Line Graph include the layout, the figures, the contrasts, and the similarities. The line graph shows the projected population growth of China and India. You should spend about 20 minutes on this task. Summarise the information by selecting and reporting the main features,...

1 min read
Updated On
Weekday Volume of Passenger Activity on the Toronto Metro system- Line Graph
The graph below shows the weekday volume of passenger activity on the Toronto Metro system for July 2007. You should spend about 20 minutes on this task Summarize the information by selecting and reporting the main features, and make comparisons where relevant. You should write at least 150 words. Report Plan Paraphrase: Paraphrase the topic sentence using synonyms. Overview: Mention the main features of the line graph and give an overview of the information provided. Paragraph 1: Elaborate on the weekday volume of passenger activity on the Toronto Metro system for July 2007. Paragraph 2: Elaborate on the weekday volume...

1 min read
Updated On
US Consumers’ Average Annual Expenditures on Cell Phone- Line Graph
The graph below shows US consumers’ average annual expenditures on cell phone and residential phone services between 2001 and 2010. You should spend about 20 minutes on this task. Summarise the information by selecting and reporting the main features and making comparisons where relevant. Write at least 150 words. Report Plan Paraphrase: Paraphrase the topic sentence using synonyms. Overview: Mention the main features of the graph and give an overview of the information provided. Paragraph 1: Elaborate on the US consumers’ average annual expenditures on the cell phone and residential phone services. Paragraph 2: Elaborate on the US consumers’ average...

1 min read
Updated On
Consumption of Fish and Different kinds of Meat in a European Country- Line Graph
The graph below shows the consumption of fish and different kinds of meat in a European country between 1979 and 2004. You should spend about 20 minutes on this task. Summarise the information by selecting and reporting the main features and making comparisons where relevant. Write at least 150 words. Report Plan Paraphrase: Paraphrase the topic sentence using synonyms. Overview: Mention the main characteristics of the graph and give an overview of the information provided. Paragraph 1: Elaborate on the different trends in meat consumption of the given country. Paragraph 2: Elaborate on the different trends in meat consumption of...

1 min read
Updated On
Percentage of Food Budget the Average Family Spent on Restaurant Meals- Pie Chart + Line Graph
The charts below show the percentage of food budget the average family spent on restaurant meals in different years. The graph shows the number of meals eaten in fast-food restaurants and sit-down restaurants. You should spend about 20 minutes on this task. Write a report for a university lecturer describing the information in the graph below. You should write at least 150 words. Report Plan Paraphrase: Paraphrase the topic sentence and use synonyms for the words used in the topic. Overview: Mention the main features of the pie charts and the line graph and give an overview of the information...

1 min read
Updated On
Water use Worldwide and Water Consumption- Line Graph and Table
The graph and table below give information about water use worldwide and water consumption in two different countries You should spend about 20 minutes on this task. Summarise the information by selecting and reporting the main features, and make comparisons where relevant. You should write at least 150 words. Country Population Irrigated land Water consumption per person Brazil 176 million 26,500 km² 359 m³ Democratic Republic of Congo 5.2 million 100 km² 8 m³ Report Plan Paraphrase: Paraphrase the topic sentence. give>portray use>utilization Overview: Mention the main features from the graph and the table. Paragraph 1: Elaborate on the main...

1 min read
Updated On
Demand for Electricity in England- Line Graph and Pie Chart
The graph below shows the demand for electricity in England during typical days in winter and summer. The pie chart shows how electricity is used in an average English home. You should spend about 20 minutes on this task. Summarise the information by selecting and reporting the main features and making comparisons where relevant. You should write at least 150 words. Report Plan Paraphrase: Paraphrase the topic sentence. Overview: Mention the main features of the two images and give an overview of the information from both these images. Paragraph 1: Explain the trends in daily demand for electricity in England...

2 min read
Updated On
IELTS Academic Writing Task 1 Topic : International conferences in three capital cities – Line Graph
Task 1: International conferences in 3 cities (line)The graph shows the information about international conferences in three capital cities in 1980 – 2010Report Plan Paraphrase: Illustrate the comparison of conferences between 1980 and 2010 in 3 cities. Overview/summary paragraph: (1) contrast rapid increase in the figures for City C (2) the number of conferences declined in Cities A and B. Paragraph 3: City A and City B: compare 1980 numbers; give figures for 2005, when both cities hosted the same number of international conferences; compare final numbers in 2010. Paragraph 4: contrast City c trend and numbers; giving figures for...

2 min read
Updated On
IELTS Academic Writing Task 1 Topic: The Percentage of Female Members of Parliament in 5 European Countries – Graph
In IELTS Writing Task 1 of the academic section, there will be a visual representation like ‘The Percentage of Female Members of Parliament in 5 European Countries’ on which you have to write a report about. Sometimes, in the IELTS Exam, you are asked to explain a Line graph. The IELTS line graph shows how data changes over time. These line graphs will have 2 axes, one is the X-axis and another is the Y-axis. The X-axis shows the time and the Y-axis shows what is being measured. The line graph highlights the trends when the data goes up and...

2 min read
Updated On
IELTS Writing Task 1 - Line Graph
In IELTS Writing Task 1 of the IELTS Academic section, there will be a visual representation or a diagram on which you have to write a paragraph. One of these visual representations may be pie charts. The IELTS line graph shows how data changes over time. These line graphs will have 2 axes, one is X-axis and another is Y-axis. While the X-axis shows the time period and the Y-axis shows what is being measured. The line graph highlights the trends when the data goes up and down. You should take only 20 minutes to complete this task and it...

6 min read
Updated On
IELTS Writing Task 1 – The Graph Below Shows Different Sources of Air Pollutants in the UK Sample Answers
This article includes sample answers for the graph below shows different sources of air pollutants in the UK, along with an outline plan to help you write your own responses. In the IELTS Writing task 1 Academic, you’ll encounter a visual representation or chart that shows data across different categories or time periods. Your task is to describe and explain the trends and comparisons in the chart. Check out a sample IELTS Bar Chart question and answer to help you prepare and boost yourlar tasks and achieve a higher IELTS band score in the IELTS Writing exam. Want to master...

2 min read
Updated On
The Percentage Of The Population In Four Asian Countries – IELTS Writing Task 1
Table of Contents[Show] Question Structure Breakdown Band 7 Sample Answer For Writing Task 1 Line Graph Band 8 Sample Answer For Writing Task 1 Line Graph Band 9 Sample Answer For Writing Task 1 Line Graph Connectors Used in the Above Sample Answers In IELTS Writing Task 1 of the academic section, there will be a visual representation like ‘The Graph Below Gives Information About The Percentage Of The Population In Four Asian Countries’ which you have to write a report about. Sometimes, in the IELTS examination, you are asked to explain a line graph. The IELTS line graph shows...

4 min read
Updated On
The Changes In Ownership Of Electrical Appliances And Amount Of Time Spent Doing Housework In Households – IELTS Writing Task 1
Table of Contents[Show] Question Structure Breakdown Band 7 Sample Answer Band 8 Sample Answer Band 9 Sample Answer Connectors Used in the Above Sample Answers In IELTS Writing Task 1 of the academic section, there will be a visual representation like ‘The Changes In Ownership Of Electrical Appliances And Amount Of Time Spent Doing Housework In Households’ which you have to write a report about. Sometimes, in the IELTS Examination, you are asked to explain a Line graph. The IELTS line graph shows how data changes over time. These line graphs will have 2 axes, one is the X-axis and...

6 min read
Updated On
IELTS Academic Writing Task 1 Topic: Price changes for fresh fruits and vegetables – Line Graph
The graph below shows relative price changes for fresh fruits and vegetables, sugars and sweets, and carbonated drinks between 1978 and 2009.Summarise the information by selecting and reporting the main features, and make comparisons where relevant.Write at least 150 words. Report Plan Paraphrase: shows>provides information; price changes for>changes in the price of Overview: The line graph provides information about changes in price of three different food product groups in the USA from 1979 to 2009. Paragraph 2: (1) Talk about the overall picture. Give a gist of the graph. Paragraph 3: (1) Talk about price changes. Give figures. Paragraph 4:...

2 min read
Updated On
IELTS Academic Writing Task 1 Topic : Percentage of Car Ownership in Great Britain – Line Graph
Describe Image is one of the most complicated tasks in the IELTS Writing module. Without a sound plan, it can be difficult to perform well on the Describe Image exercise. The Line Graph is the ideal format for practising the Describe Image problem because it has logically and simply organised all of the components. Elements of the Line Graph include the title, the legend, the X-Axis, and the Y-Axis. Percentage of car ownership in Great Britain according to household. Report Plan Paraphrase: percentage of car ownership>proportions of car owned; Overview: The graph demonstrates the proportion of cars owned by household...

2 min read
Updated On
IELTS Academic Writing Task 1 Topic 38: Paris Metro station passengers – Line Graph
IELTS Line Graph questions based on themes like Paris Metro station passengers are one of the significant components of the Academic Writing section. In this question, you are required to prepare a report of at least 150 words. So, this article has been prepared to help you with IELTS line graphs. You should spend about 20 minutes on this task.The line graph shows Paris Metro station passengers. Summarise the information by selecting and report in the main features, and make comparisons where relevant.Write at least 150 words. Report Plan Paraphrase: show>designates; Paris Metro station passengers>number of people using a metro...

2 min read
Updated On
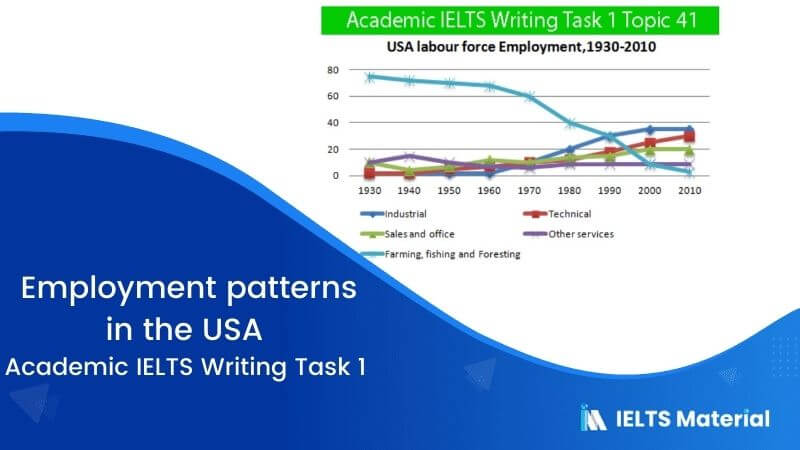
IELTS Academic Writing Task 1 Topic 41: Employment patterns in the USA – Line Graph
The graph below presents the employment patterns in the USA between 1930 and 2010. Summarise the information by selecting and report in the main features, and make comparisons where relevant. Write at least 150 words. Report Plan Paraphrase: presents>represents; employment patterns in the USA >patterns of employment in America Overview: The given graph represents the patterns of employment in America between the time period of 1930 and 2010. Paragraph 2: (1) Talk about the employment patterns in different sectors. Give figures. Paragraph 3: (1) Talk about the employment patterns in different sectors. Give figures. Paragraph 4: (1) Talk about the...

2 min read
Updated On


