IELTS Writing Task 1 Topics with Model Answers
Limited-Time Offer : Access a FREE 10-Day IELTS Study Plan!
Sample 1:
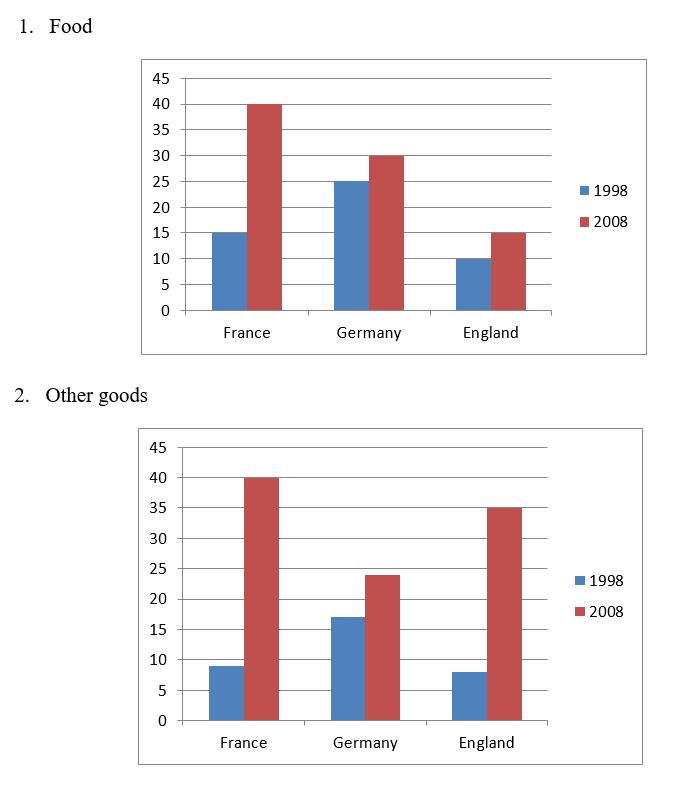
The charts show the percentage of income spent on food and other goods in 3 European countries from 1998 – 2008.
Sample 2:
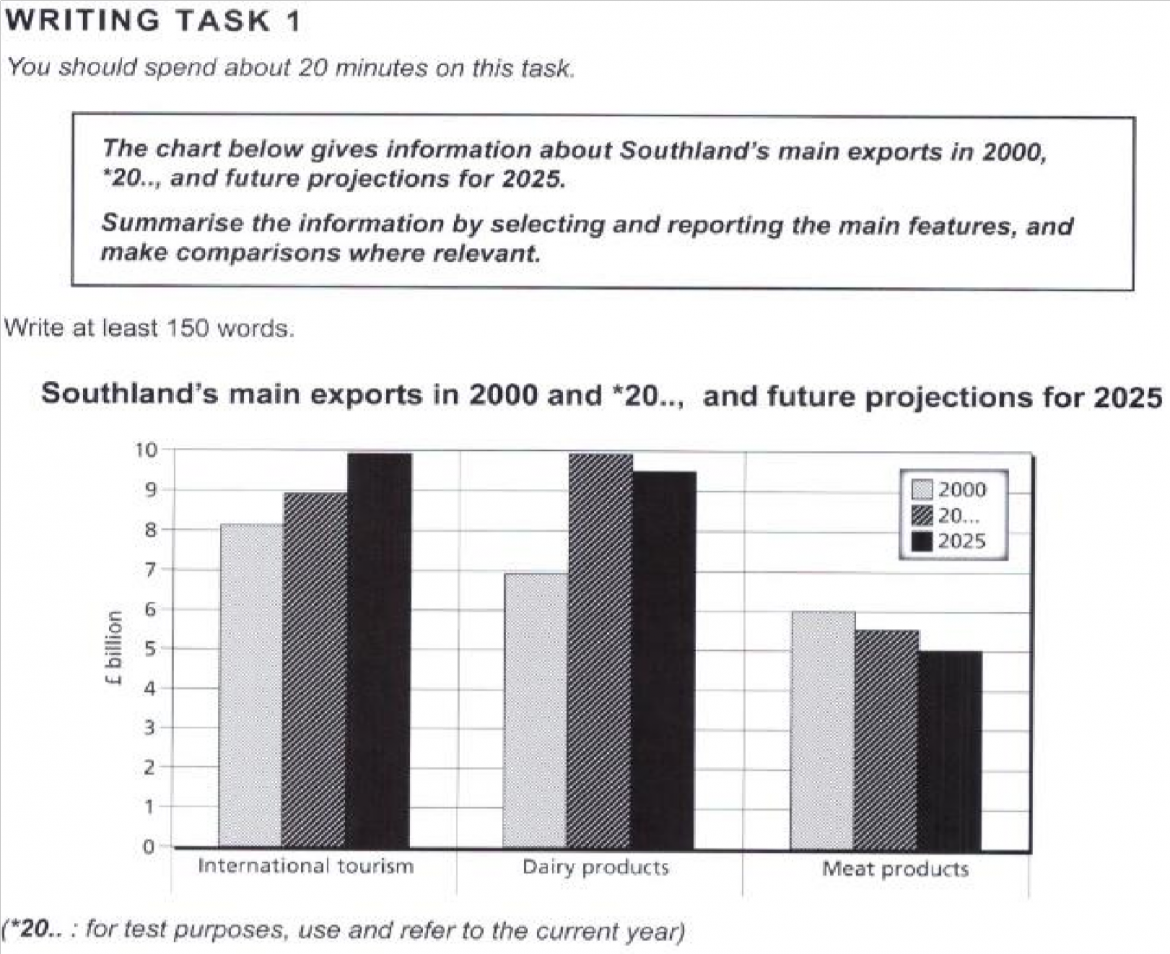
The chart below gives information about Southland’s main exports in 2000, .. and future projections for 2025.
Sample 3:
The table shows the relative amount of GDP that five different countries invested in healthcare services in 2002.
| Total | Public spending | Private spending | |
| Japan | 7.20% | 5.80% | 1.40% |
| Italia | 7.70% | 5.30% | 2.40% |
| German | 9.30% | 7% | 2.30% |
| France | 11.40% | 8.60% | 2.80% |
| USA | 8.60% | 6% | 2.60% |
Sample 4:
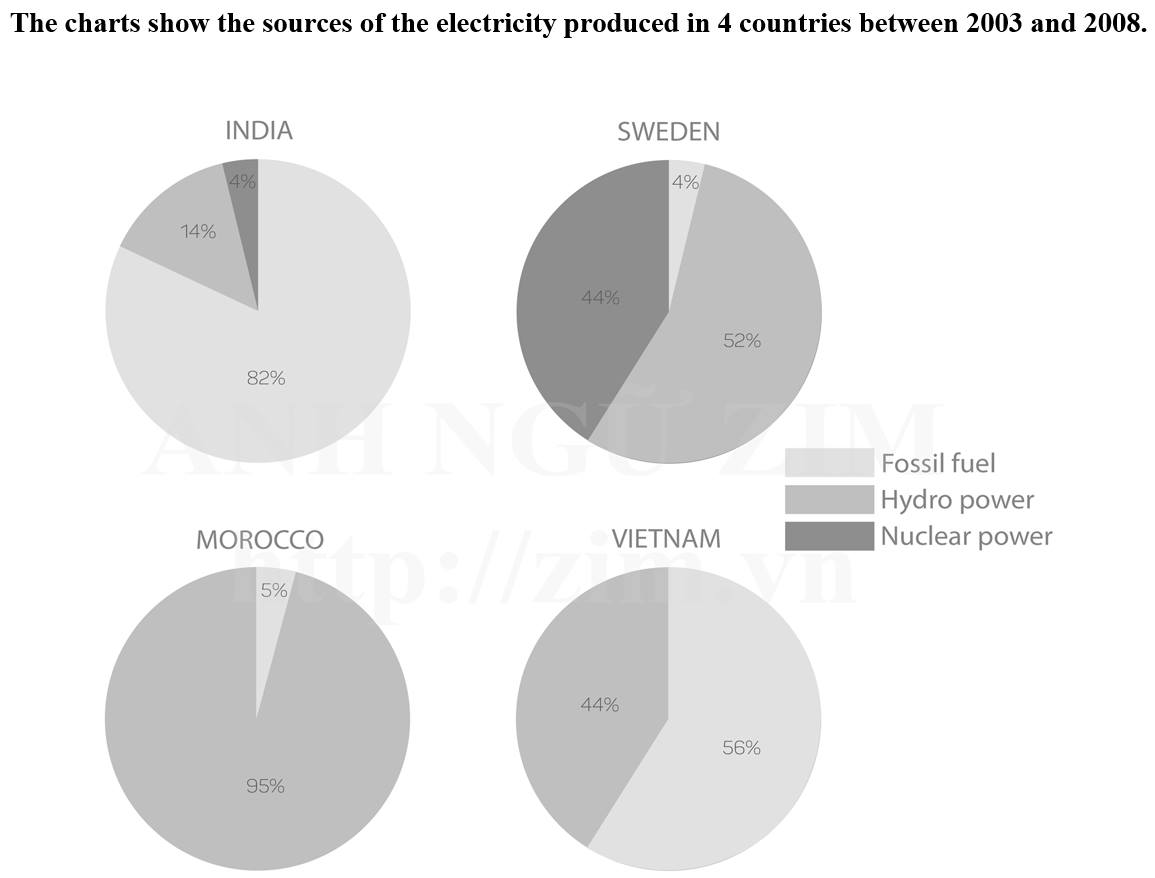
The charts show the sources of the electricity produced in 4 countries between 2003 and 2008
Sample 5:
The table below gives information about past and projected population figures in various countries for different years. Summarise the information by selecting and reporting the main features, and make comparisons where relevant.
Sample 6:
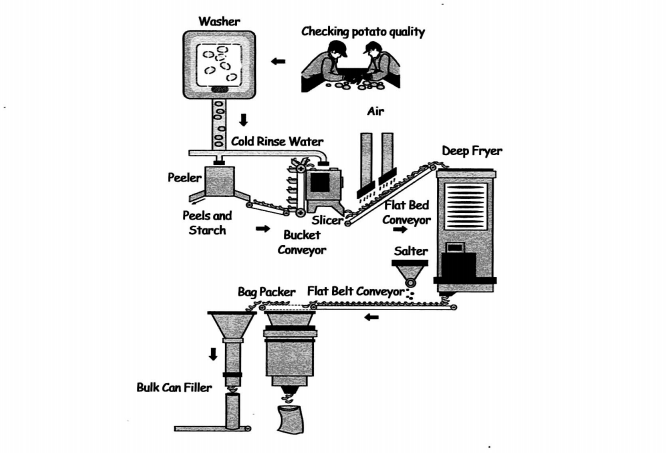
The diagram below shows how potato chips are made.
Summarise the information by selecting and reporting the main features, and make comparisons where relevant. Write at least 150 words.
Sample 7:
The charts below give information on the ages of people when they got married in one particular country in 1996 and 2008. Summarise the information by selecting and repairing the main features, and make comparisons where relevant.

Also check :
Explore IELTS Writing
Start Preparing for IELTS: Get Your 10-Day Study Plan Today!
Explore other Writing Articles

Janice Thompson
Recent Articles
Nehasri Ravishenbagam
Whitney Houston

Raajdeep Saha




Post your Comments
3 Comments