IELTS Academic Writing Task 1 Topic 33: Five countries spending habits of shopping on consumer goods – Bar Chart
Table of Contents
Limited-Time Offer : Access a FREE 10-Day IELTS Study Plan!
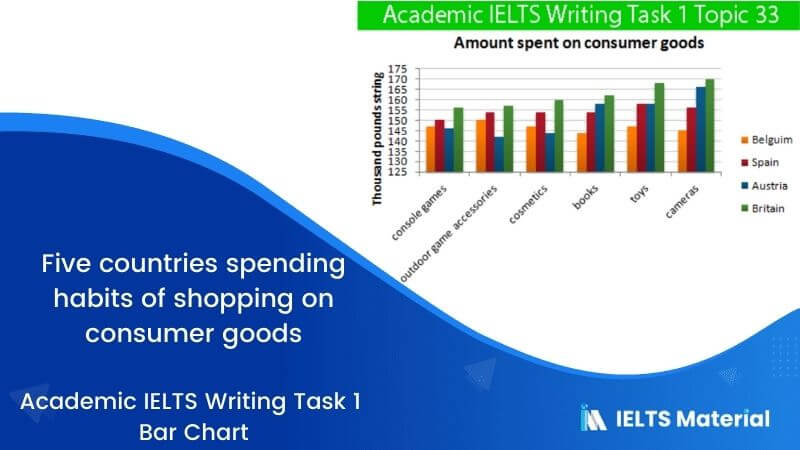
The bar chart below gives information about five countries spending habits of shopping on consumer goods in 2012.
Summarise the information by selecting and reporting the main features, and make comparisons where relevant.
Write at least 150 words.
Report Plan
Paraphrase: gives information>depicts; spending habits >spending patterns
Overview: This bar chart depicts the spending patterns of Belgians, Spaniards, Austrians and Brits on six varying merchandises in 2012.
Paragraph 2: (1) compare expenditure on different products. Give figures.
Paragraph 3: (1) compare expenditure on different products. Give figures.
Paragraph 4: (1) compare expenditure on different products. Give figures. Also, conclude the topic.
Sample Answer
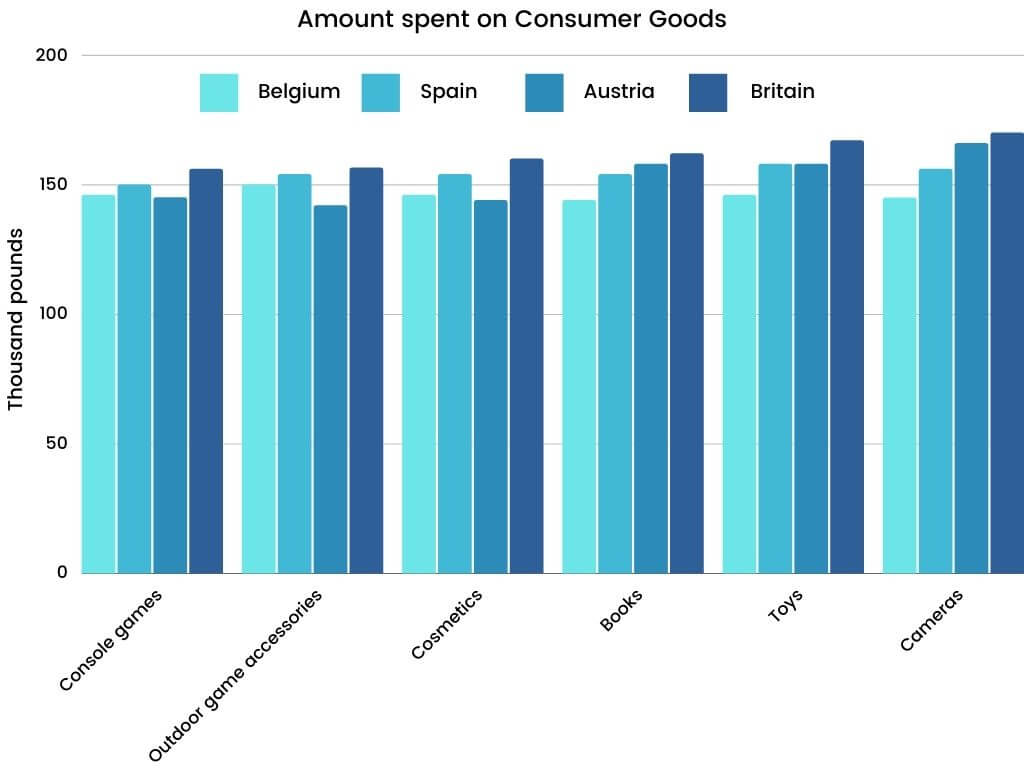
This bar chart depicts the spending patterns of Belgians, Spaniards, Austrians and Brits on six varying merchandises in 2012. Overall, Brits have spent a higher amount on buying these commodities. Products like books, cameras and toys cost higher than gaming consoles, outdoor gaming accessories and cosmetics.
As per the data, the British have spent a bit more than 155-thousand-pound sterling on console games in 2012, and the other three countries spent anywhere between 145 to 150 thousand each. To purchase outdoor sports equipment, Britishers disbursed nearly 156 thousand, which is quite closer to the spending of Spaniards. On the same product, in the same year, Austrians ended up spending the lowest.
Going further, people residing in Belgium and Austria bought almost 145 thousand pounds worth of cosmetics while the amount spent on this product in Spain and Britain was nearly 10 and 15 thousand more. It must be noticed that Britishers spent the highest amount on these items in 2012, and their greatest expense ratio accounted for buying toys and cameras. For English people, books cost more than 160 thousand while for Belgians, it was the lowest, nearly 15 thousand less.
The interest of these countries in owning toys and cameras showcased a similar pattern. Austrians favoured spending on cameras more than toys. British people spent between 167 to 170 thousand on these two products. Again, Austrians spent the least, which was nearly 145-thousand-pound sterling.
Get evaluated for FREE!
Got a quick report in your mind for this question. Don’t hesitate to post the same in our comment section. We will evaluate the report/letter and email you the band score & our trainer’s comments. And, this service is entirely free.
Also check:
- IELTS Writing Task 1
- IELTS Bar chart
- IELTS Pie chart
- IELTS Table chart
- IELTS Writing task 1 line graph
- IELTS Writing task 1 Map
- IELTS Writing task 1 tips
- Tips to Improve IELTS Writing Skills
- IELTS Writing recent actual test
- IELTS Writing Answer sheet
- IELTS map vocabulary
- IELTS Writing Task 1 Connectors
Practice IELTS Writing Task 1 based on report types
Start Preparing for IELTS: Get Your 10-Day Study Plan Today!
Explore other sample Bar Charts

Janice Thompson
Recent Articles
Kasturika Samanta
Janice Thompson
Janice Thompson


Post your Comments