IELTS Academic Writing Task 1 Topic 17: Numbers of male and female research students studying six computer science subjects at a US university – Bar Graph
Table of Contents
Limited-Time Offer : Access a FREE 10-Day IELTS Study Plan!
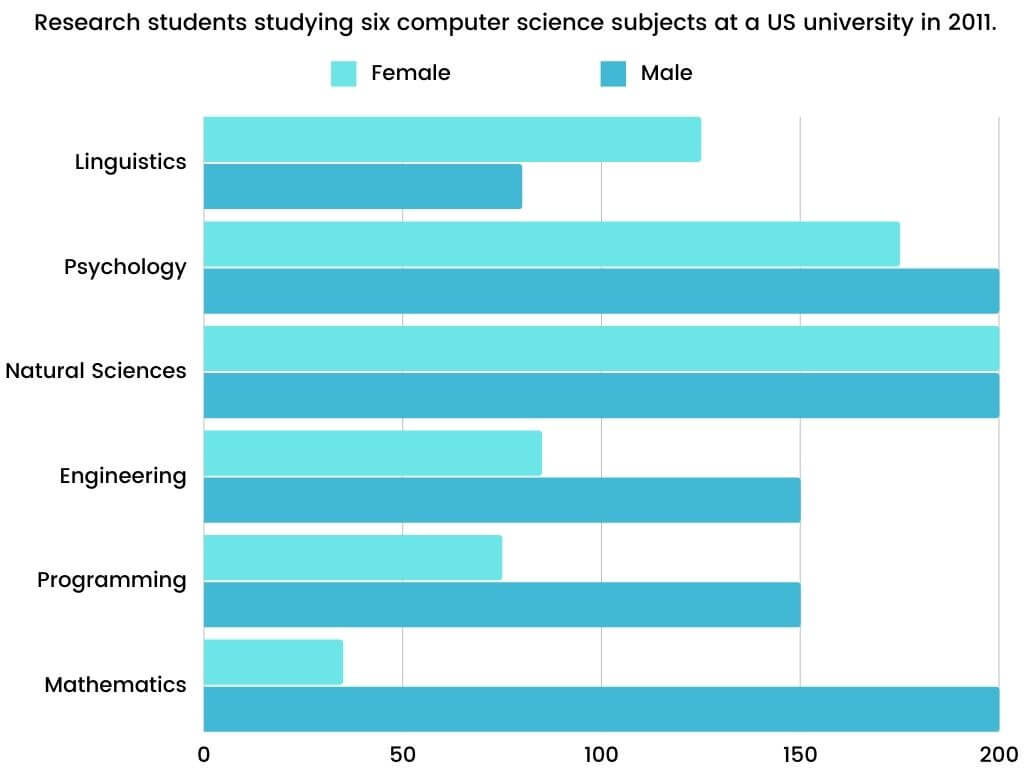
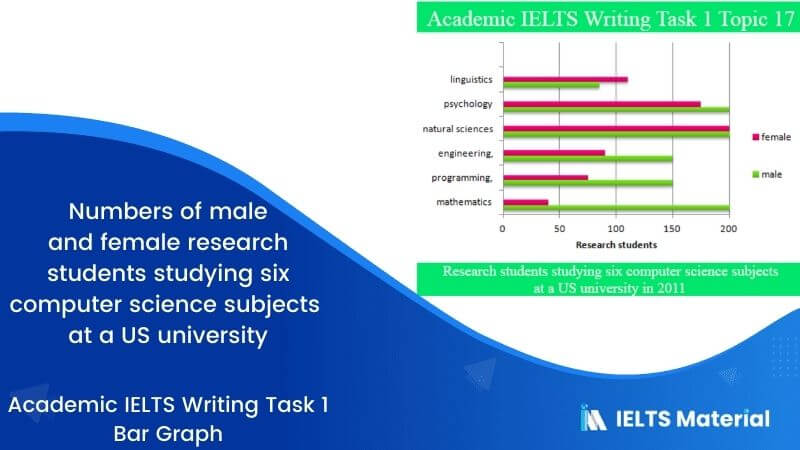
The bar graph below shows the numbers of male and female research students studying six computer science subjects at a US university in 2011.
Summarise the information by selecting and report in the main features, and make comparisons where relevant.
Write at least 150 words.

Report Plan
Paraphrase: the bar graph below>the provided bar chart;numbers of male and female research students studying six computer science subjects>comparison between the numbers of male and female students enrolling in the research study in six different subjects
Overview: The bar chart shows the comparison between the numbers of male and female students enrolling in the research study in six different subjects.
Paragraph 2: (1) compare enrolled number in different streams. Give figures.
Sample Answer
The provided bar chart shows the comparison between the numbers of male and female students enrolling in the research study in six different subjects, like linguistic, psychology, natural science, engineering programming and mathematics at an American University. Overall, the graph shows that there are more male students enrolled in the research field in comparison to female students.
As per the provided illustration, both female and male students got an equal number of entries in natural science. As far as mathematics is concerned, male students had greater interest than females. Moreover, male entrants can be seen in all of the subjects except for linguistics. It is clear from the provided data that natural science turned to be the most sought subject for both genders as it recorded 400 entrants altogether (200 on each). In mathematics, men recorded another 200 entries as opposed to merely 50 female students. Additionally, in the psychology subject, there were almost 375 entrants. Even here, male students dominated at 200 and females were at 175. On the other hand, linguistic defined a completely different story as female enrollers toppled the number of male entrants at approximately 120 to 80, respectively.
Get evaluated for FREE!
Got a quick report in your mind for this question. Don’t hesitate to post the same in our comment section. We will evaluate the report/letter and email you the band score & our trainer’s comments. And, this service is entirely free.
Also check:
Practice IELTS Writing Task 1 based on report types
Start Preparing for IELTS: Get Your 10-Day Study Plan Today!
Explore other sample Bar Charts


Janice Thompson
Recent Articles
Kasturika Samanta
Janice Thompson

Janice Thompson


Post your Comments
3 Comments