The number of prisoners in five varying countries – IELTS Academic Writing Task 1
Table of Contents
Limited-Time Offer : Access a FREE 10-Day IELTS Study Plan!

Report Plan
Paraphrase: shows>illustrates; figures of imprisonments>the number of prisoners
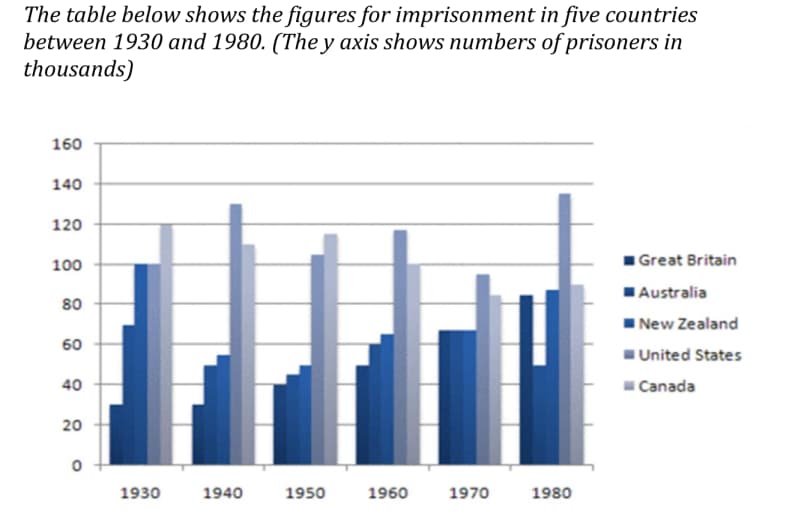
Overview: The bar chart illustrates the number of prisoners in five varying countries, during the period of 50 years.
Paragraph 2: (1) compare the number throughout the period in different countries. Give figures.
Paragraph 3: (1) compare the number throughout the period in the remaining different countries. Give figures.
Sample Answer
The bar chart illustrates the number of prisoners in five varying countries, namely Great Britain, Australia, New Zealand, United States and Canada, during the period of 50 years, embarking from 1930. The overview gives an impression that the rate of imprisonment in the USA and UK escalated while the number decreased in Canada, Australia and New Zealand.
As it is evident, Great Britain had the lowest number throughout the first 40 years until 1980. It is noteworthy that this country witnessed a consistent growth, which commenced from nearly 30000 in 1930 and reached around 700000 in 1970. In contrast, the US had the highest number of criminals throughout the years, except the first decade. Also, in 1980, the US had the highest number of imprisoners, which accounted for nearly 130000.
It is noticeable from the graph that the crime rate in Canada gradually and steadily decreased from 1930 to 1980, with the number as 120000 people in the former year and 90000 in the latter. Also, except for 1930 and 1980, Australia had significantly less number of prisoners. Seemingly, New Zealand always stood at the third position, while Canada and the US remained ahead of it.
Also check :
Practice IELTS Writing Task 1 based on report types
Start Preparing for IELTS: Get Your 10-Day Study Plan Today!
Explore other Writing Actual Tests


Kasturika Samanta
Recent Articles
Kasturika Samanta
Janice Thompson

Janice Thompson


Post your Comments