Books Read by Men and Women at Burnaby Public Library – IELTS Writing Task 1
5 min read
Updated On
-
Copy link
Table of Contents
- Structure Breakdown
- Band 7 Sample Answer For Writing Task 1 Line Graph – ‘Books Read by Men and Women at Burnaby Public Library’
- Band 8 Sample Answer For Writing Task 1 Line Graph – ‘Books Read by Men and Women at Burnaby Public Library’
- Band 9 Sample Answer For Writing Task 1 Line Graph – ‘Books Read by Men and Women at Burnaby Public Library’
- Connectors Used in the Above Sample Answers of ‘Books Read by Men and Women at Burnaby Public Library’
- Practice Writing Mock Tests with a Purpose for IELTS: Conclusion
- Useful Links:
Limited-Time Offer : Access a FREE 10-Day IELTS Study Plan!
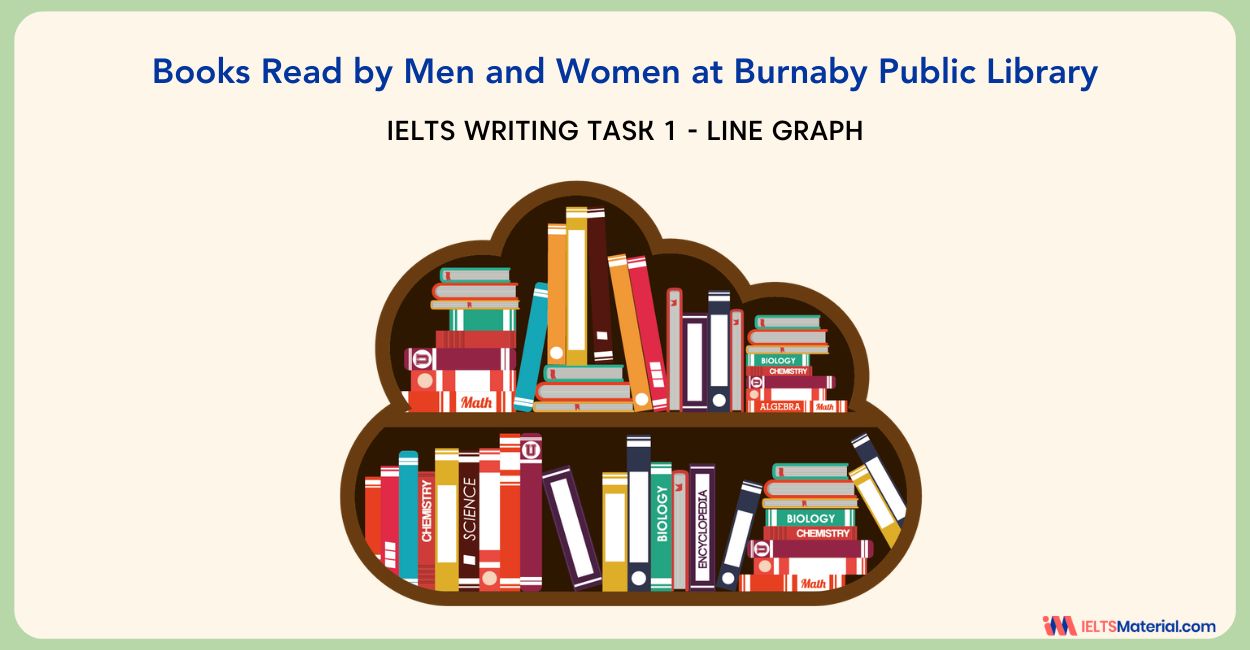
In IELTS Writing Task 1 of the academic section, there will be a visual representation like ‘Books Read by Men and Women at Burnaby Public Library’ which you have to write a report about.
Sometimes, in the IELTS examination, you are asked to explain a line graph. The IELTS line graph shows how data changes over time. These line graphs will have 2 axes, one is the X-axis and another is the Y-axis. The X-axis shows the time and the Y-axis shows what is being measured. Moreover, the line graph highlights the trends when the data goes up and down.
Let’s now have a look at the Line Graph – ‘Books Read by Men and Women at Burnaby Public Library’ – with three expert-curated sample answers for different IELTS band scores ranging from band 7-9!
The graph below shows the number of books read by men and women at Burnaby Public Library from 2011 to 2014.
Summarise the information by selecting and reporting the main features, and make comparisons where relevant.
Structure Breakdown
|
Question Type Line Graph Introduction Paraphrase the prompt and mention the time frame. Overview Highlight key features, focusing on changes, highs, lows, and patterns. Avoid specific data details. Main Body Paragraph 1 Organize based on major trends or categories of the graph. Use specific data for analysis. Main Body Paragraph 2 Add some more points based on major trends of the graph. Use specific data for analysis. |
Band 7 Sample Answer For Writing Task 1 Line Graph – ‘Books Read by Men and Women at Burnaby Public Library’
The graph shows us the number of books read at the Burnaby Public Library by men and women during the four years of 2011 to 2014. Overall, the number of books read by men has been on a steady increase during the mentioned period. While more books were read by women at the start of this period their numbers dropped down by the final year.
Firstly, there is a reasonable difference between men and women, with the number of books read by men on a steady increase during this period, while the number of books read by women was on the rise till 2013, after which it was on a decline.
The number of books read by men increased from about 3000 in 2011 to 4000 in 2012, then 10,000 in 2013, and then to 14,000 in 2014, which was the highest figure between the two in that period. To mention, in this period, women read more books than men with the number starting at around 5000 in 2011 and increasing to 8000 books in 2012, and then rising to 10,000 books in 2013.
(188 Words)
Aspiring to crack line graphs like ‘Books Read by Men and Women at Burnaby Public Library’ in 1 go?
Sign up for a FREE demo now!
Band 8 Sample Answer For Writing Task 1 Line Graph – ‘Books Read by Men and Women at Burnaby Public Library’
The provided line graph shows the shifting reading patterns among males and females at Burnaby Public Library over a span of three years starting from 2011. Overall, women read more books than men at the beginning of the mentioned years at Burnaby Public Library; but the number of books that men read continually increased as time went by while for women, this figure declined after having risen steadily in the initial years.
In 2011, women were more in number than men in reading, with 5,000 books compared to men’s 3,000, showcasing an evident preference for book reading among the female group. Subsequently, in the following year, although both genders increased their reading habits, women’s book consumption surged by 5,000 books, doubling that of men, who saw a one-third increment in their reading.
By 2013, both genders read 10,000 books, with men’s reading going up a lot. Notably, men’s interest in reading books skyrocketed and showed a substantial increase from the previous year 2012. However in 2014, men read 14,000 books, but women only read 7,000, which was a big drop for this gender.
(189 Words)
Grab both 4.5+ rated IELTS Academic Writing Ebooks for the price of 1!
Band 9 Sample Answer For Writing Task 1 Line Graph – ‘Books Read by Men and Women at Burnaby Public Library’
The given line graph illustrates the book reading habits of men and women at the Burnaby Public Library from 2011 to 2014. Overall, it is seen that initially, women readers were more at the Burnaby Public Library but later, men read more books while that was the opposite in the case of the female group.
Initially, women exhibited a greater interest in reading, surpassing men in the number of books read, with 5,500 books compared to men’s 2,500 in 2011. However, a shift occurred over the following years, with both genders experiencing an increase in reading. While the females’ book consumption saw a gradual increase, men’s number had a drastic increase around 2012.
By 2013, the reading habits of both men and women were the same, with each group having read approximately 10,000 books. Anyways, the numbers shifted dramatically in 2014, with men surpassing women in book consumption wherein, they reached a peak of reading around 14,000 books, while women’s reading dropped significantly to just 7,000 books.
(172 Words)
Connectors Used in the Above Sample Answers of ‘Books Read by Men and Women at Burnaby Public Library’
Connectors, also known as connectives or transition words, are words or phrases that link ideas or parts of a sentence or paragraph together. Here are some of the connectors used in the above sample answers:
- Overall
- Firstly
- However
- To mention
- Subsequently
- Initially
- While
- Furthermore
- Anyways
- Regarding
Remember to proofread your essay for grammar, vocabulary, and spelling errors. These tips, combined with practice, will help you write well-structured and coherent IELTS Writing Task 1 Line graph answers like ‘Books Read by Men and Women at Burnaby Public Library.’
Practice Writing Mock Tests with a Purpose for IELTS: Conclusion
If you are preparing for the IELTS Writing exam, we would recommend you practice tasks like the above given IELTS Writing questions regularly. The more you practice, the better you will become at cracking the writing tasks for IELTS within the dedicated timeframe.
You can also enrol in our IELTS preparation online classes to get your hands on the latest IELTS writing questions or participate in our free online webinars to learn how to write them directly from the IELTS experts!
Useful Links:
- IELTS Academic Writing Task 1 Topic 38: Paris Metro station passengers – Line Graph
- Information about the rates of unemployment | Line Graph – IELTS Academic Writing Task 1 Practice Test 34
- IELTS Writing Practice Test 30 (Task 1 & 2) & Sample Answers
- IELTS Academic Writing Task 1 Topic: Price changes for fresh fruits and vegetables – Line Graph
- IELTS Academic Writing Task 1 Topic: International conferences in three capital cities – Line Graph
Also check :
Explore IELTS Writing
Start Preparing for IELTS: Get Your 10-Day Study Plan Today!
Explore other Writing Practice Tests
Nehasri Ravishenbagam
Nehasri Ravishenbagam
Recent Articles
Nehasri Ravishenbagam
Whitney Houston

Raajdeep Saha



Post your Comments
6 Comments